Hydraulic Selections Minimize the Unscheduled Maintenance Portion of Life Cycle Cost
Written by R. Barry Erickson, Eugene P. Sabini, Anthony E. Stavale, ITT Industries, Fluid Technology Corp.
Improved installation practices and increased attention to operating procedures has increased the mean time between failures (MTBF) at process plants.
Abstract
Recently significant attention has been given to the life cycle cost of owning a pump. Major components of the cost of ownership are initial cost, installation cost, operating cost, and maintenance cost. For nearly all applications it has been found that the initial cost is a very small percentage of the life cycle cost.
In most commercial and municipal applications, the cost of power is the largest component of the cost of ownership. This validates use of efficiency as the primary selection factor. Even though the cost is high, opportunities to significantly reduce the operating cost are limited because the efficiency of pumps and motors are near their theoretical maximums. Further reductions in this cost component will come from improvements in the process.
In process plants it has been found that under many circumstances the cost of unscheduled maintenance is the most significant cost of ownership. Although numerous papers have been presented on the subject of pump reliability, that literature addresses mechanical means of improving reliability only, and does provide an objective guide for the user. There has been little published on the subject of the best hydraulic fit to optimize reliability.
A test program was initiated to quantify the effects of three hydraulic reliability factors: operating speed, impeller diameter and operating point. Experimental measurements for each factor are compared to a published method that proposed a quantitative evaluation to guide the Application Engineer in making the best choice.
Experimental measurements confirm the reliability chart for operating speed. The test data also confirms an optimum impeller diameter (between 60 –80% of the trim range) exists where reliability can be maximized. The operating capacity and impeller diameter charts show generally good agreement below best efficiency capacity and for impeller diameters below the optimum trim range, respectively. Recommendations are given for modifying the operating capacity and impeller diameter reliability charts for flows greater than best efficiency capacity and for impeller trims above optimum diameter, respectively.
Introduction
Reliability of centrifugal pumps has received considerable attention in recent years. The results of this attention have been an increase in the Mean Time Between Failure (MTBF) for process plants. A survey conducted seven years ago by one of the authors revealed that in the North American chemical industry the MTBF for chemical process pumps was 15 months. Today the norm in the chemical industry is closer to 24 months and the refining industry approaches 5 years. Hrivnak [1] reported an increase in MTBF by a factor of 5.5 in a major chemical plant as a result of an extensive pump reinstallation project. His impressive results were achieved through improved installation practices, and increased attention to operating procedures.
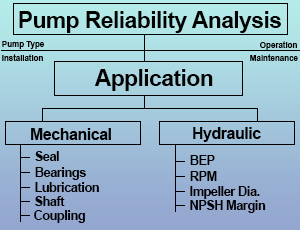
Efforts such as these will continue to yield improvements in MTBF, but will be limited in potential unless a holistic approach is used. Such an approach involves addressing all the factors of a Reliability Engineered System. Figure 1 illustrates the components of such a system.
The authors believe there are five significant factors that must be properly Engineered in order to achieve a reliable pump installation. Figure 1 illustrates these factors and gives examples of each. It is necessary to address each factor in a successful MTBF plan. The literature abounds with information on best practices for specifying the type, installation, and application of centrifugal pumps. Additionally, many courses are available that provide training on operation and maintenance.
Specifying a pump with the optimum mechanical configuration is enabled through manufacturer’s literature, as well as many papers. Similarly, general guidelines exist for good hydraulic application. Rules such as “select a pump to operate at best efficiency point”, “slower speeds are better”, and “provide adequate NPSH margin” are common axioms. In most applications though, it is not possible to select a pump near best efficiency point, or impractical to select a slower speed pump. The Application Engineer is left to subjective judgement in making the hydraulic application.
Bloch [2] has published a method that quantifies the effects of three hydraulic application factors: speed, impeller diameter tip clearance, and operating point. This method defines three Reliability Factors and proposes a quantitative evaluation of each to guide the Application Engineer in making the best choice. Although the method provides quantitative evaluations, it is itself subjective. It is the purpose of this paper to test the validity of the method using experimental measurements.
Background
The Reliability Factors are considered as non-dimensional numbers based on a relative index ranging from 0–1. The three individual factors are combined into one overall Reliability Index (RI) by multiplying them together. A value of zero does not imply zero reliability, but is intended to discourage application at that condition. Conversely, a value of one does not imply infinite reliability, but is intended to indicate that that is the best condition one can select. Thus the factors indicate a relative reliability of one selection, or operating condition, as opposed to the alternative. Clearly they also only apply to those conditions that are within the control of the Application Engineer. Operator controlled effects are not addressed. Because the mechanical design of a pump also affects its reliability, the RI can not be used to compare pumps of different design or manufacture. It can be effectively used to compare alternative selections of one design, or the effects of alternative operating conditions on a given pump.
Speed
Speed affects reliability directly through:
- Heat generation between seal faces
- Heating of the bearing lubricant
- Seal face wear
- Bearing life
- Abrasive wear
Heat in the seal faces causes checking of the seal faces, and deterioration of the static sealing elements. Although frictional heating is generally linearly related to face velocity, the checking and degradation may increase nonlinearly with temperature.
Heating of the bearing lubricant reduces the viscosity of the lubricant, which reduces rolling element bearing life, and in extreme cases can reduce the film thickness in journal bearings to the point where surface contact occurs. In this paper only rolling-element bearings will be considered. Increased temperature also increases the oxidation rate of lubricants, which increases the corrosion potential in the bearings. Lubricant temperature rise and reduction of viscosity
are all nonlinear effects.
Seal face wear also increases non-linearly with face velocity. Face wear reduces face contact pressure increasing the potential for leakage. Seal manufacturers publish data on wear rates and acceptable face wear. Wear rates nonlinearly increase with face velocity.
The reliability factor is intended to compare alternate selections of similar designs for a specified duty. In this context, a slower speed pump will have a larger impeller diameter, and greater impeller width. Thus the bearing loads will be comparable. Given that, rolling-element-bearing life is inversely related to speed.
Impeller Diameter
Conventional wisdom suggests that a pump should be selected with an impeller diameter that is as close to the maximum as possible. The theory is that by minimizing the clearance gap between the impeller and the casing tongue, hydraulic efficiency is maximized. For this reason many hydraulic designers design the impeller with as little as 5% clearance ((tongue diameter – impeller diameter)/ impeller diameter x 100). While this may provide good mechanical performance at design flow, fluid angles leaving the impeller blades at off design flows are mismatched with the tongue angle. This results in the development of significant pressure pulsation. This pressure pulsation impacts the impeller causing a radial shaft deflection at a frequency equal to the blade passing frequency. This motion also occurs at the seal faces resulting in a translating motion of the faces, rather than a pure rotary motion for which the faces were designed. Translating motion will cause fluid migration across the faces, and if solids are present, can pull solids between the seal faces.
Providing a greater opportunity for the fluid to adjust to the tongue angle after it leaves the impeller vanes can mitigate this effect. There are two ways this can be done, by reducing the impeller diameter, or by reducing the pump speed. It would appear that the smaller the impeller diameter is, the more reliable the pump should be. Experience has shown though that as the impeller diameter is trimmed, the impeller vane overlap decreases, increasing the likelihood of discharge and suction recirculation. Bloch [2] proposes the optimum diameter is 75% of the trim range (maximum diameter – minimum diameter). The authors will investigate this proposition experimentally.
It should be noted that shaft deflection due to impeller radial loads (static loads) is not considered. From a reliability point of view, radial loads affect bearing life, and produce static deflection. The differences in bearing life due to impeller diameter are not considered to be significant, and the effect is partially addressed under the “speed” heading. Static radial loads also produce fully reversed bending stresses in the shaft, which affect fatigue life. That effect is not considered here because it is assumed that the pumps under consideration are designed for infinite (1010 cycles) fatigue life under the allowable operating conditions.
Operating Point
It is well recognized that centrifugal pumps run “best” when operating at the best efficiency point. The geometry of the impeller and casing are designed around a single flow rate. At this flow rate (BEP) the fluid kinetics are matched to the impeller and casing geometry. Not only is efficiency optimized as a result, but also the dynamic mechanical loads are minimized.
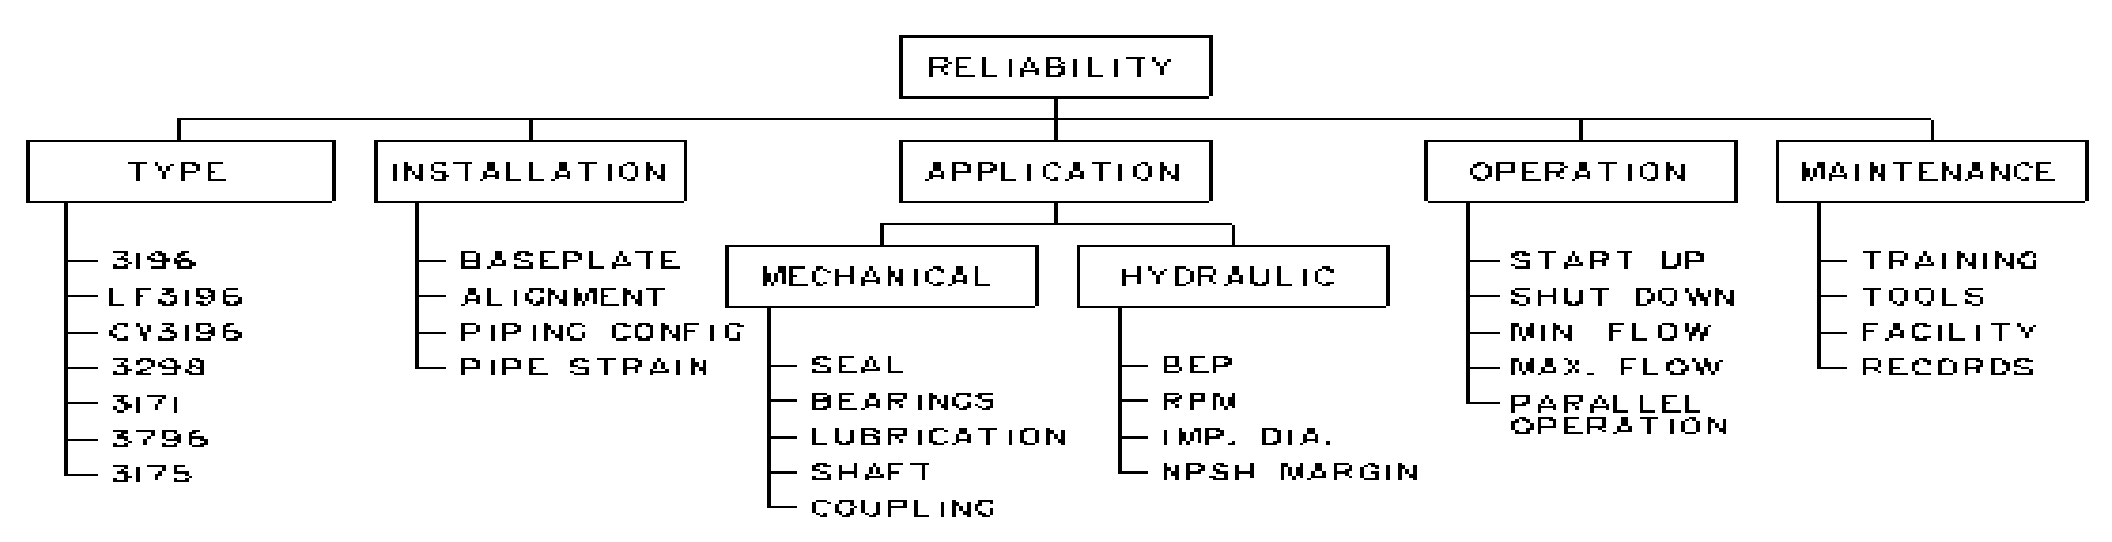
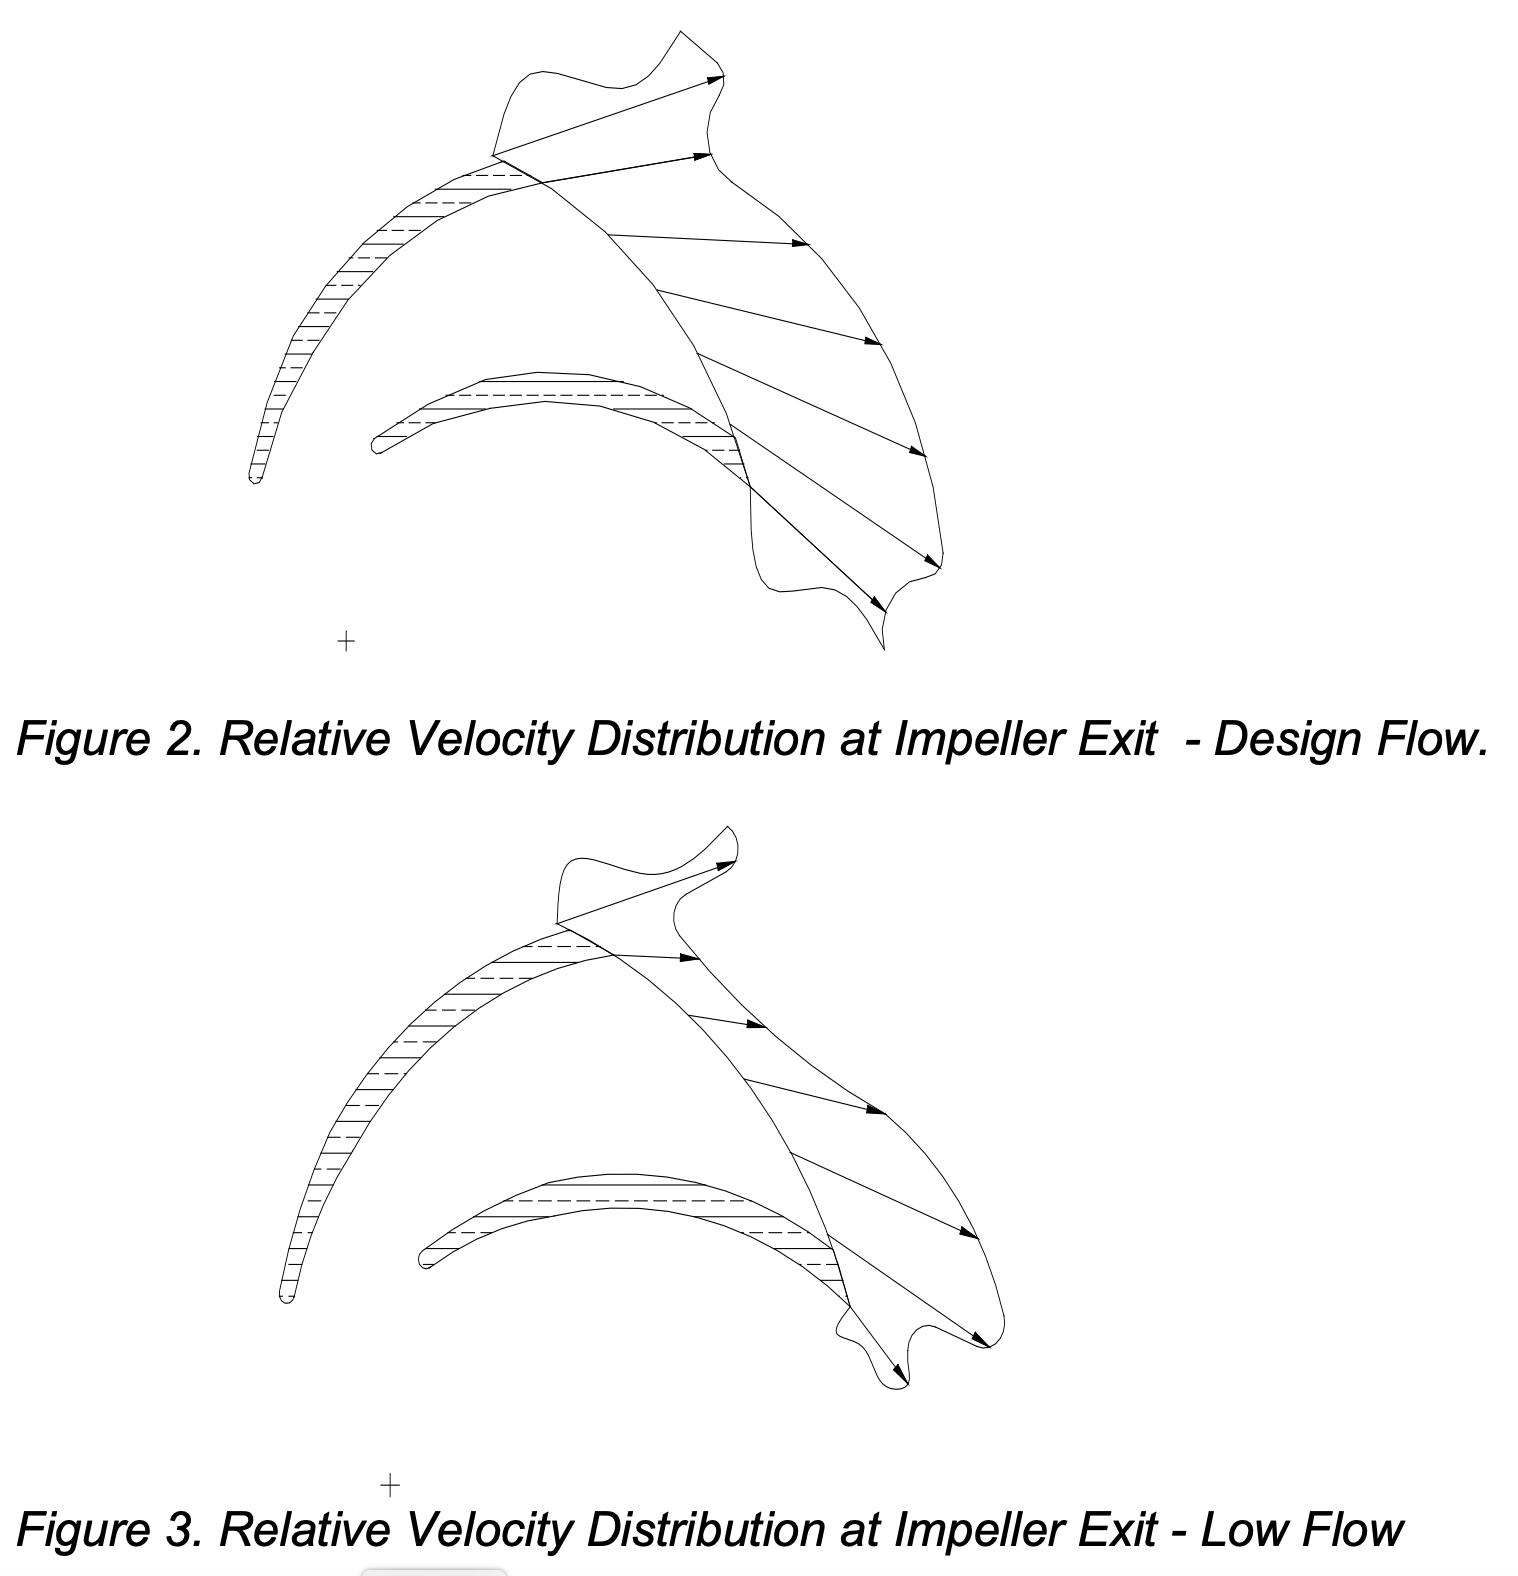
Figure 2 is a general representation of the fluid velocity vectors leaving an impeller vane at design conditions. Note that the vector magnitudes are nearly equal, and that the vector directions are nearly the same. In contrast, Figure 3 illustrates conditions when operating at less that design flow. Note now that both the magnitude and direction of the vectors vary from the high pressure to low pressure side of the vane. Because of this variation it is impossible to design a collector that accepts the flow smoothly. As a result, dynamic forces are created which produce shaft deflection as discussed above.
In the design of machinery it is usually desired that components be sized to accept the loads that are imposed on them. This practice is successful when designing machinery for specific applications. In the pump industry, particularly with process pumps, a common bearing frame is used across a range of hydraulic components. The frames are then designed to accept the largest loads, and are “over designed” for smaller pumps. Consequently, the effect of off design point operation is less detrimental from a reliability point of view in smaller pumps.
In the following sections of this paper the authors will describe an experimental program designed to test the above hypothesis.
Experimental Setup and Methodology
Based on the proposal that there are three major operator/application factors, which effect pump reliability, a test program was initiated to obtain sufficient data to substantiate the numerical values, which have been proposed for each reliability factor.
Operating Speed
As mentioned previously, operating speed affects reliability through rubbing contact/ wear in seal faces, reduced bearing life through increased cycling, lubricant degradation and reduced viscosity due to increased temperature, and wetted component wear due to abrasives in the pumpage.
Rubbing contact wear in face seals has been well documented by seal manufactures. This data will be discussed in the results section.
Reduced bearing life is one of the major contributors to premature failures in pumps. Since oil temperature is a major indicator of bearing distress, oil temperature vs. speed was measured at constant load. All tests were conducted using a constant load since bearing loads are roughly comparable for slower speed pumps operating at the same duty point due to the larger impeller diameter and width.
The model chosen for these tests was an ANSI B73 Group I bearing frame. Loads were applied at the impeller end of the shaft via adjusting springs. Load cells were used to measure both radial and axial loads. A constant 670 N radial load and 446 N axial load were applied to the shaft at each of four test speeds: 1200, 2000, 2800 and 3600 r/min. These loads yielded an L10 bearing life of 16,800 h at the line bearing and 139,000 h at the thrust bearing at 3600 r/min. The bearing lubricant was an ISO Grade VG68 mineral oil. Thermocouples were installed to measure ambient, oil sump, and radial bearing outer race and thrust bearing outer race temperatures. Each test speed was run until all temperature points were stabilized. Measurements were collected on a strip chart recorder.
Operating Range
A centrifugal pump is designed to operate most reliably at one capacity for a given speed and impeller diameter. This capacity is usually at or near the best efficiency flow. As pump operation moves away from this optimum capacity, turbulence in the casing and impeller increases. As a result hydraulic loads, which are transmitted to the shaft and bearings, increase and become unsteady. The severity of these unsteady loads can have the same detrimental effect on mechanical seal life as previously discussed in the background section (impeller diameter).
The indicators that were selected to determine this effect were discharge pressure pulsation at vane pass frequency and vibration at the pump bearings. The selection was made based on the knowledge that pressure pulsation and vibration at the pump bearings will increase as pump operation moves away from the best efficiency flow. Prior to testing it was indeterminate as to which measurement was best suited to be indicative of operating range reliability.
Impeller Diameter
Impeller diameter affects reliability by the loads that are imposed on the shaft and bearings as the impeller vanes interact with the volute cutwater. Maximum, or near maximum, impeller diameters reduce the opportunity for the fluid leaving the impeller vanes to adjust to the geometry of the cutwater. As each impeller vane passes the cutwater a large pressure pulse is produced which results in an accompanying deflection of the pump shaft. It is expected that there is an optimum gap that will limit these blade pass deflections. With larger than optimum gaps the damaging effect is minimized and the effects of suction and discharge recirculation become more of an issue, especially if vane overlap is lost.
The main indicators for the effect of reliability on impeller diameter are dynamic shaft deflection, discharge pressure pulsation and vibration at the pump bearings.
Prior to the onset of testing it was expected that dynamic shaft deflection would be the lead indicator in validating the reliability factor for impeller diameter. However, once testing commenced it was soon found that shaft deflection decreased with increasing impeller diameter at a given speed. It is felt that a hydrodynamic bearing effect was generated between the casing and impeller ring annular seal. This phenomenon better known as the Lomakin Effect can produce significant shaft stiffening which tends to center the pump rotor. Since the magnitude of this force would be insignificant in low head closed impeller pumps and non-present in open impellers it was decided not to use shaft deflection data as a reliability indicator for the test pumps selected.
High frequency vibration detection (HFD) was used as an alternate method of determining the impact and significance of pressure pulsation on dynamic deflection relative to impeller cutwater clearance. High frequency detection methods utilize a high frequency piezoelectric accelerometer to detect impacts that occur in a system. Transducer resonant frequencies are forced by the high frequency vibration signals of these impacts. HFD is a measure of the intensity of the energy generated by these repetitive impacts. These impacts can be a result of either mechanical or hydraulic conditions in a pump. Typical examples of these impacts are metal-metal rubbing, loss of lubrication in bearings, cavitation, pressure pulsation, suction and discharge recirculation, etc.
Experimental Program
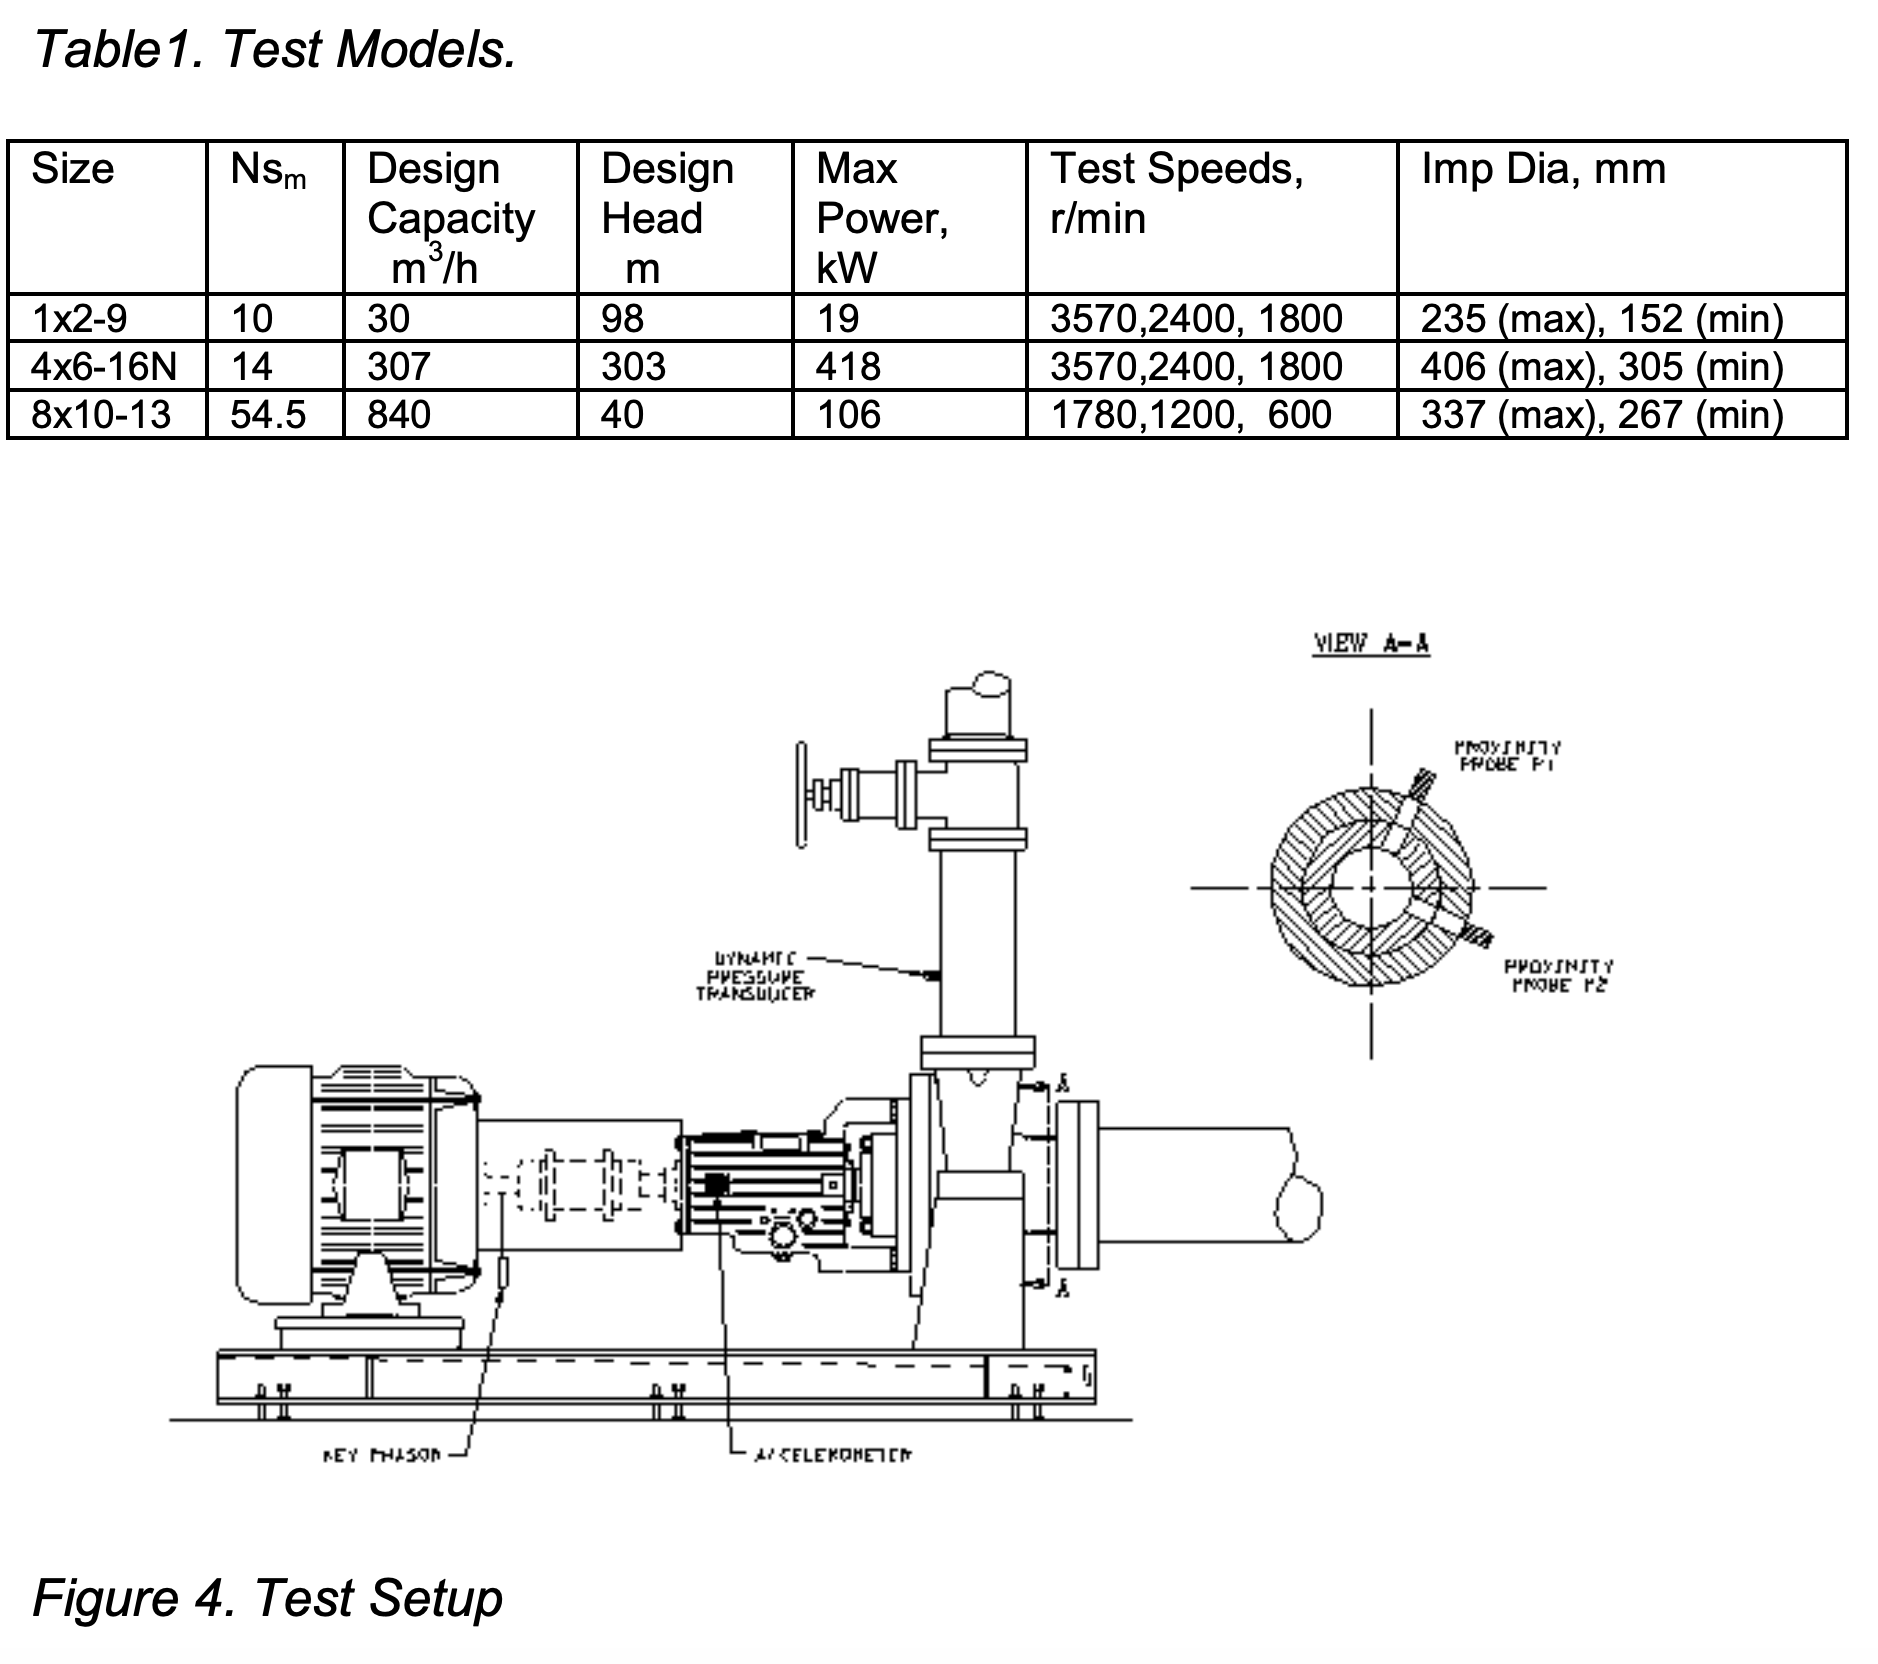
Test Models
The test models selected were three (3) API-610 single stage overhung process pumps covering a specific speed range of 10 to 54.5. These style closed impeller pumps were largely selected to easily measure shaft deflection at the front casing ring. Each shaft was undercut in an area outboard of the radial bearing in order to exaggerate shaft deflection. Standard API ring clearances were used. Table 1 shows the test models selected.
Instrumentation
Each test pump was instrumented with two proximity probes 90o apart at the front casing ring to measure shaft deflection. A pressure transmitter was located at a distance two pipe diameters downstream of the pump discharge flange. Pressure pulsation measurements were taken at vane pass and all pass frequencies. The pressure transmitter was located at a position in the pipe, which was parallel to the pump shaft. Bearing housing vibration was measured in a plane horizontal to the thrust bearing since this is the least stiff plane and generally the point of highest vibration. A high frequency piezoelectric accelerometer was also mounted in a horizontal plane to the thrust bearing to measure HFD energy. The test setup is shown in Figure 4.
Test Procedure, Data Recording, and Processing
Pressure pulsation, shaft deflection, HFD energy and vibration data were all collected on an SKF Microlog data processor. The data processor is a vibration signal analyzer that can perform overall (RMS) and spectral analysis for one signal input at a time. Prior to testing, a Bentley Nevada Digital Vector Filter (DVF3) was used to compensate for mechanical and electrical runout of the rotor. Pressure pulsation data (p-p) was collected at vane pass and overall (0- 1000 Hz). Bearing housing overall vibration data was also collected (peak velocity) between 0-1000 Hz. HFD data (g’s peak) was recorded over a frequency range of 5 kHz – 60 kHz. Flow points were taken at eight equally spaced intervals between closed valve and 140% BEP for each test model. Each pump was tested at the speeds and impeller diameters shown in Table 1.
Results and Discussion
Operating Speed
In determining the influence of operating speed on reliability four major factors were considered: viscosity reduction and oxidation of bearing lubricant due to increased operating temperature, rubbing contact wear in seal faces and wetted component wear due to abrasives in the pumpage. Reduced bearing life and seal face wear is two primary causes of premature pump failure.
Effect of Increased Bearing Operating Temperature
Table 2 is a summary of oil sump and bearing operating temperature for the test model previously described. Testing was performed at four speeds under a constant radial (670 N) and axial load (446 N).
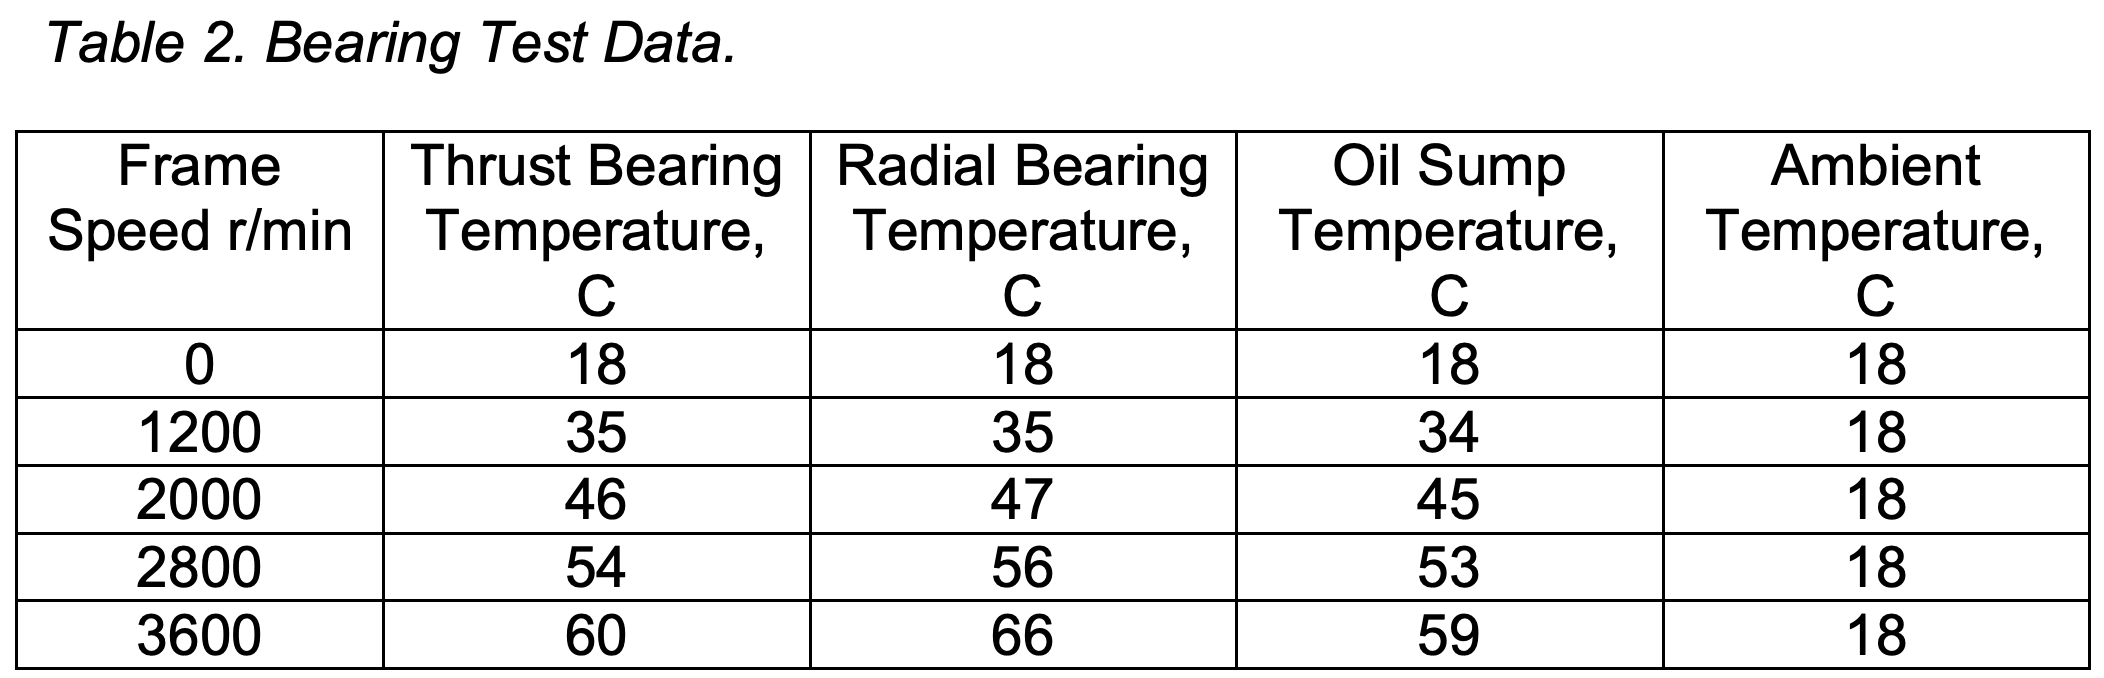
Table 3 shows the calculated L10 radial bearing life, life adjustment factor (a3) and adjusted radial bearing life L10a at each test speed. The bearing lubricant life adjustment factor (a3) is determined by the ratio of actual operating viscosity to the minimum viscosity required for adequate lubrication. For reliable operation an adequate load-carrying lubricant film must be formed. The lubricant must have a given minimum operating viscosity at the bearing operating temperature. As bearing operating temperature increases, the lubricant operating viscosity is reduced beyond the minimum range thereby effecting life.
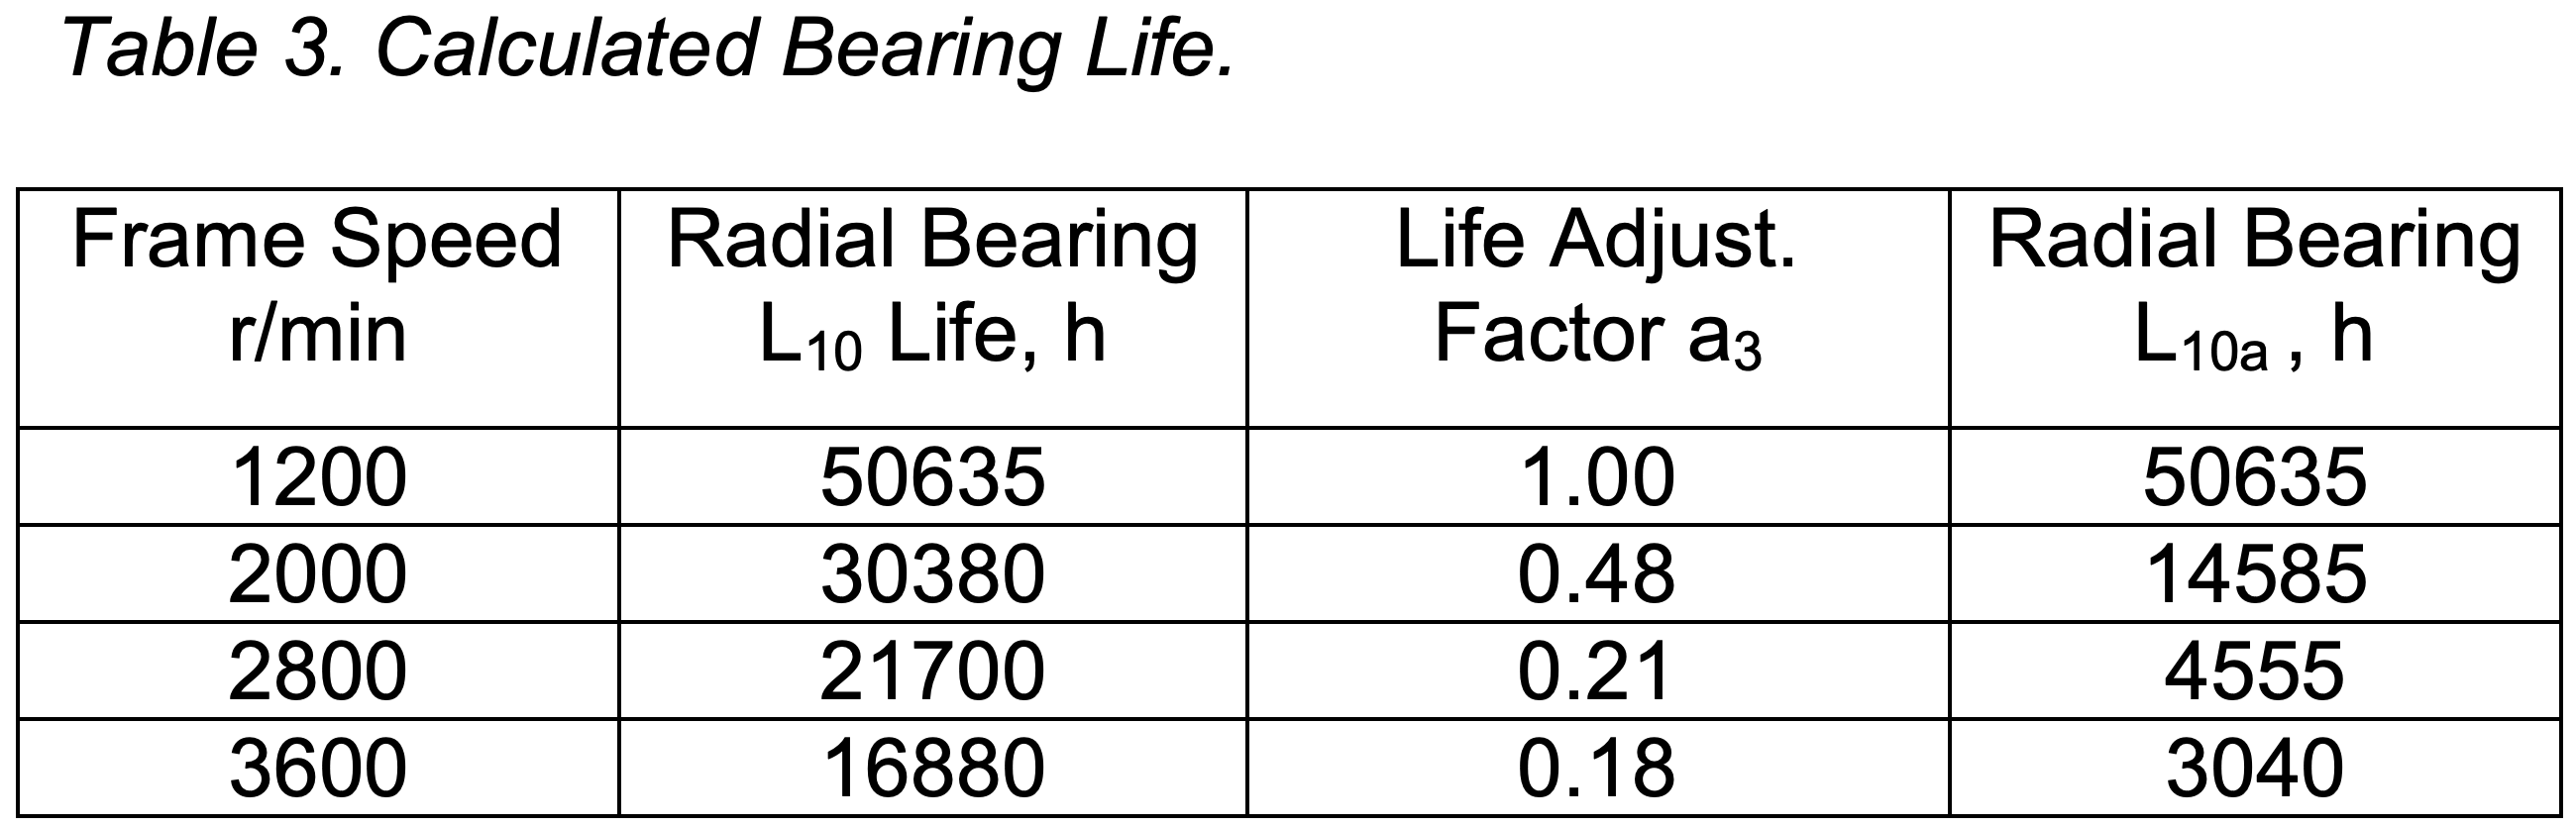
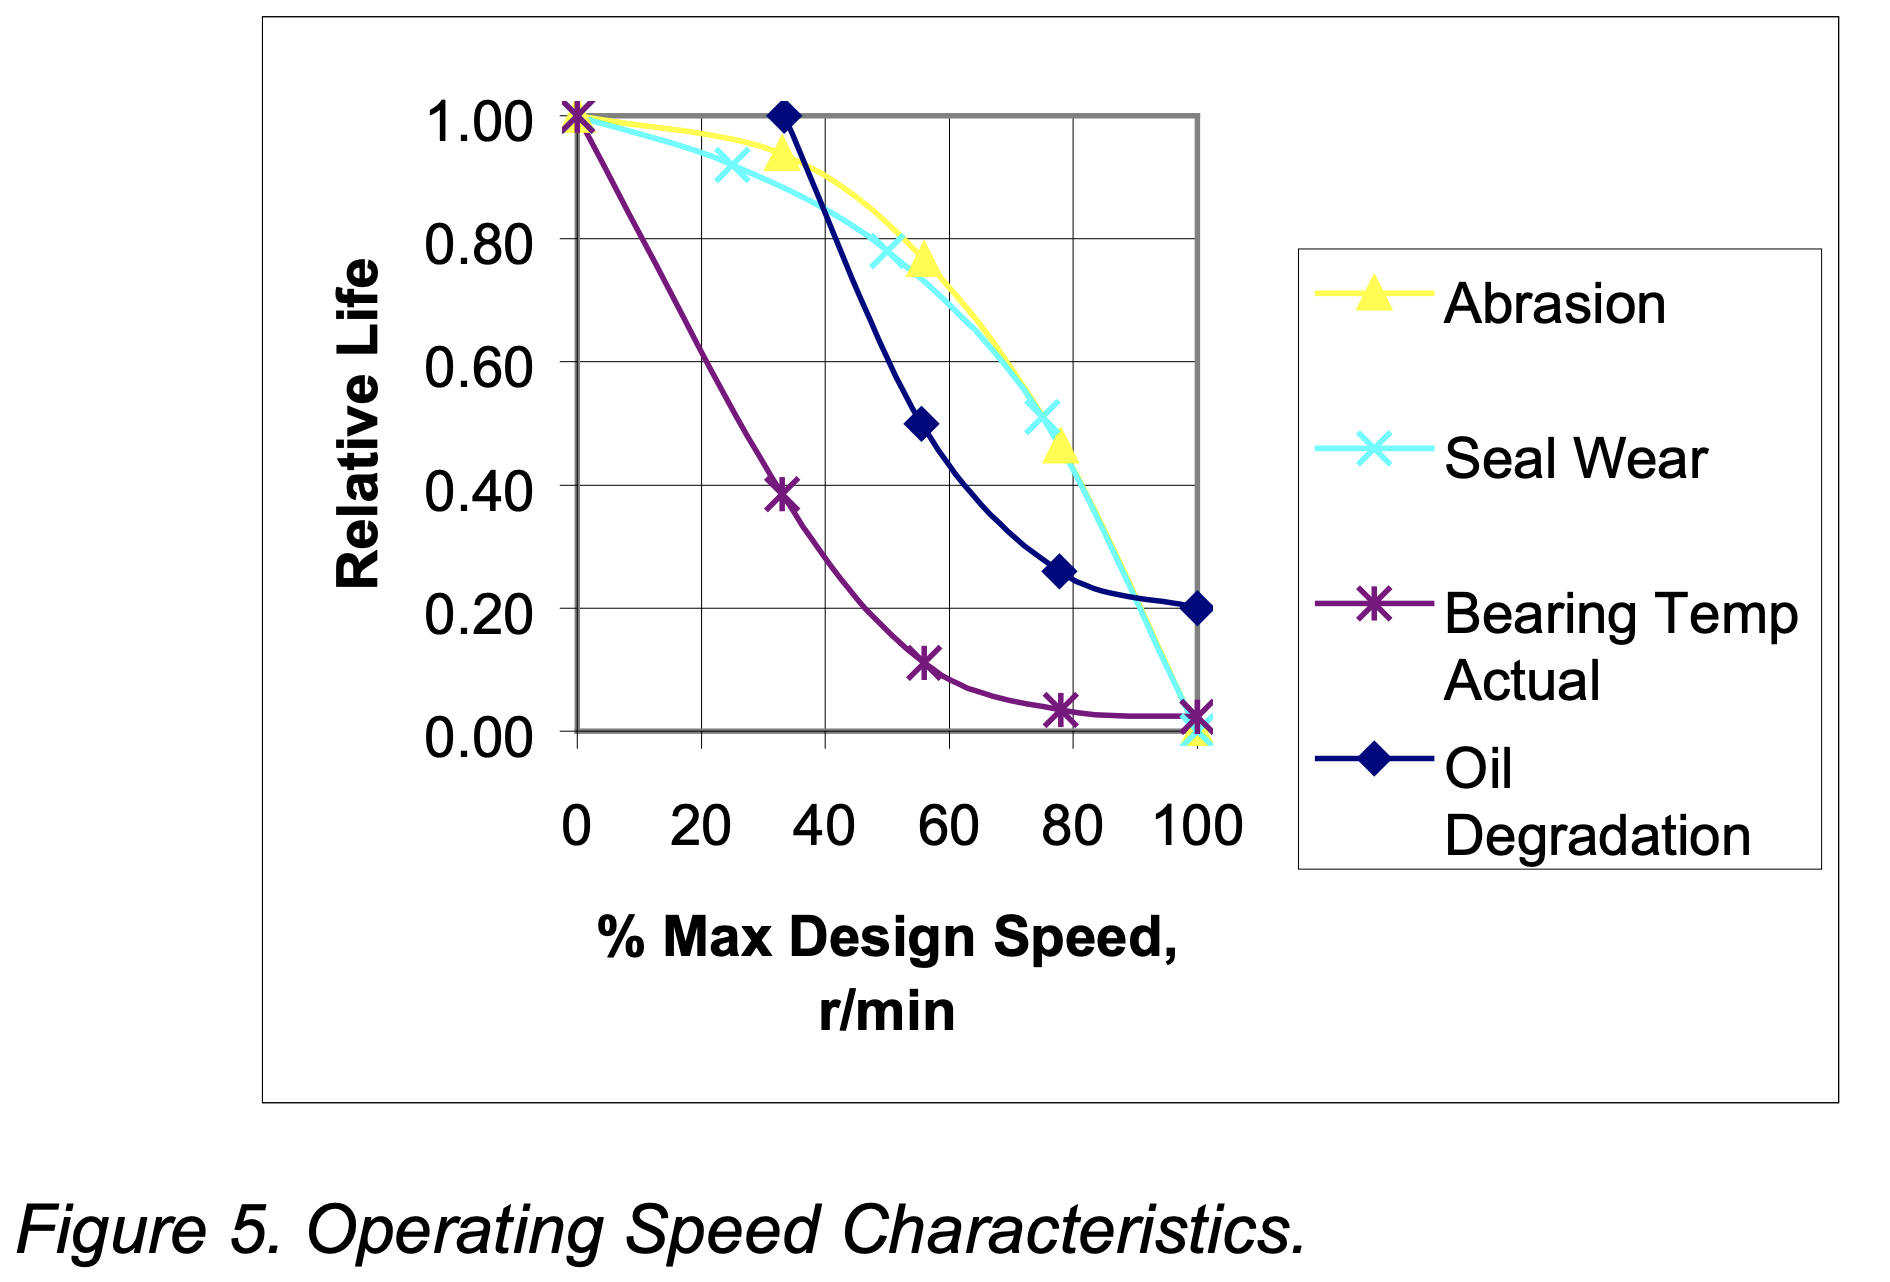
Figure 5 shows adjusted radial bearing life data expressed on a non-dimensional life scale between zero and unity. Where zero represents the least life and unity represents best life for a given application. Since the lifetime of a pumping system is often in the range of 15-20 years, the L10a data was normalized on the relative life scale using a 15-year continuous service life.
It is felt that oil degradation is an important factor to be included in determining pump reliability. It is known that mineral oils will age and oxidize with increasing rapidity as temperature increases and that these oxidation products have a detrimental effect on lubrication. The oil degradation curve shown in Figure 5 is based on a doubling of the oxidation rate for every 10-deg C temperature rise [3].
Effect of Seal Face Wear
Typical seal face wear charts were reviewed for stationary face materials of ceramic and tungsten carbide running against a carbon-graphite rotating face [4]. The PV limit corresponding to a two-year life line for these materials is 35.03 and 175.15 bar m/s, respectively. Although the PV vs. Wear curves for these seal face combinations are different the wear characteristic curves are essentially identical when expressed as percentages. The seal face wear curve shown in Figure 5 is shown on a non-dimensional relative life scale between zero and unity where zero represents the least life and unity represents the best possible life for a given application.
Effect of Abrasive Wear
The rate of abrasive wear in a centrifugal pump is proportional to the particle velocity m , where m can range between 2.5-4 [5]. The wear curve shown in Figure 5 is based on an m value of 2.5. Similar to the other factors, abrasive wear is expressed on a non-dimensional relative life scale where zero represents the least life and unity represents the best possible life for a given application. As shown in Figure 5, the seal wear and abrasive wear curves are similar.
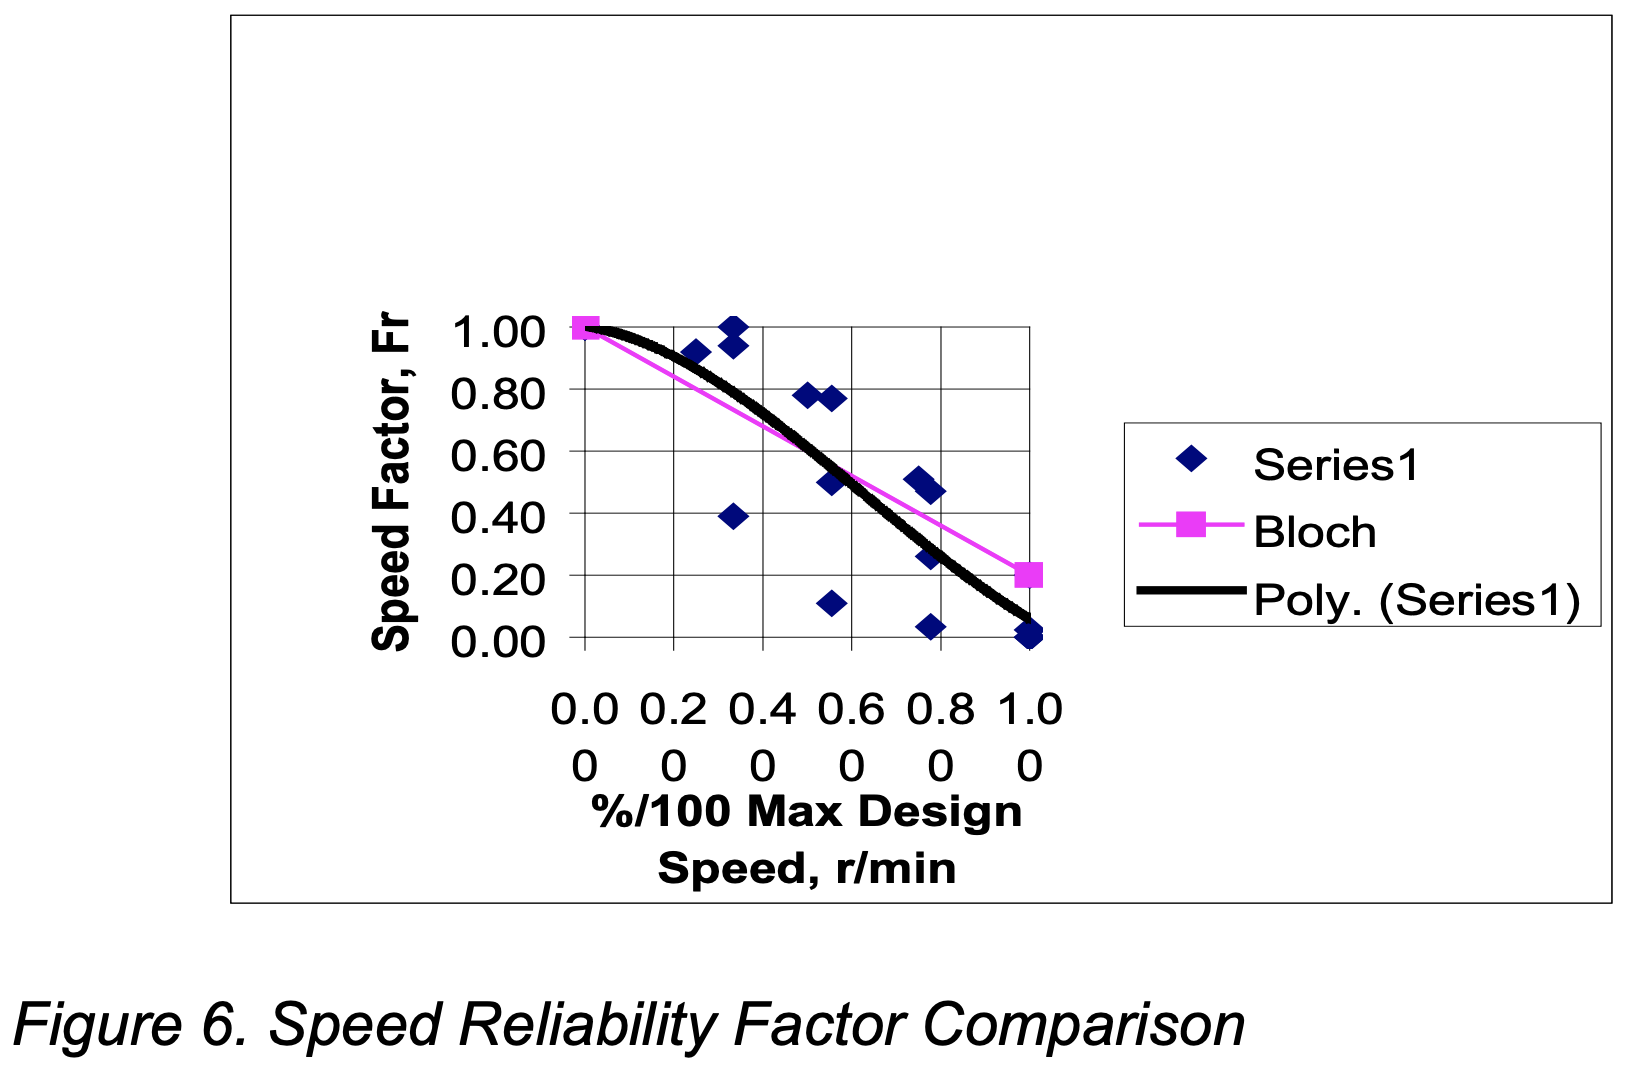
Operating Speed Reliability Factor
Figure 6 shows the best curve fit (3rd order polynomial) for all combined data shown in Figure 5. The reliability factor for speed, Fr, is shown to vary from 1.0 at zero speed to 0.1 at maximum design speed. For example a pump designed to operate at a maximum speed of 3600 rpm will have a Fr value of 0.1. The same pump operating at one-half maximum design speed (1800 r/min) will have a Fr value of 0.6. This reflects a five-fold increase in pump reliability based solely on operating speed. It is interesting to note that although each of the characteristic curves shown in Figure 5 is clearly nonlinear the best curve fit for the data approaches linearity. As shown in Figure 6 the curve fit trendline agrees closely with the original work done by Bloch [2].
Lomakin Effect on Measured Data
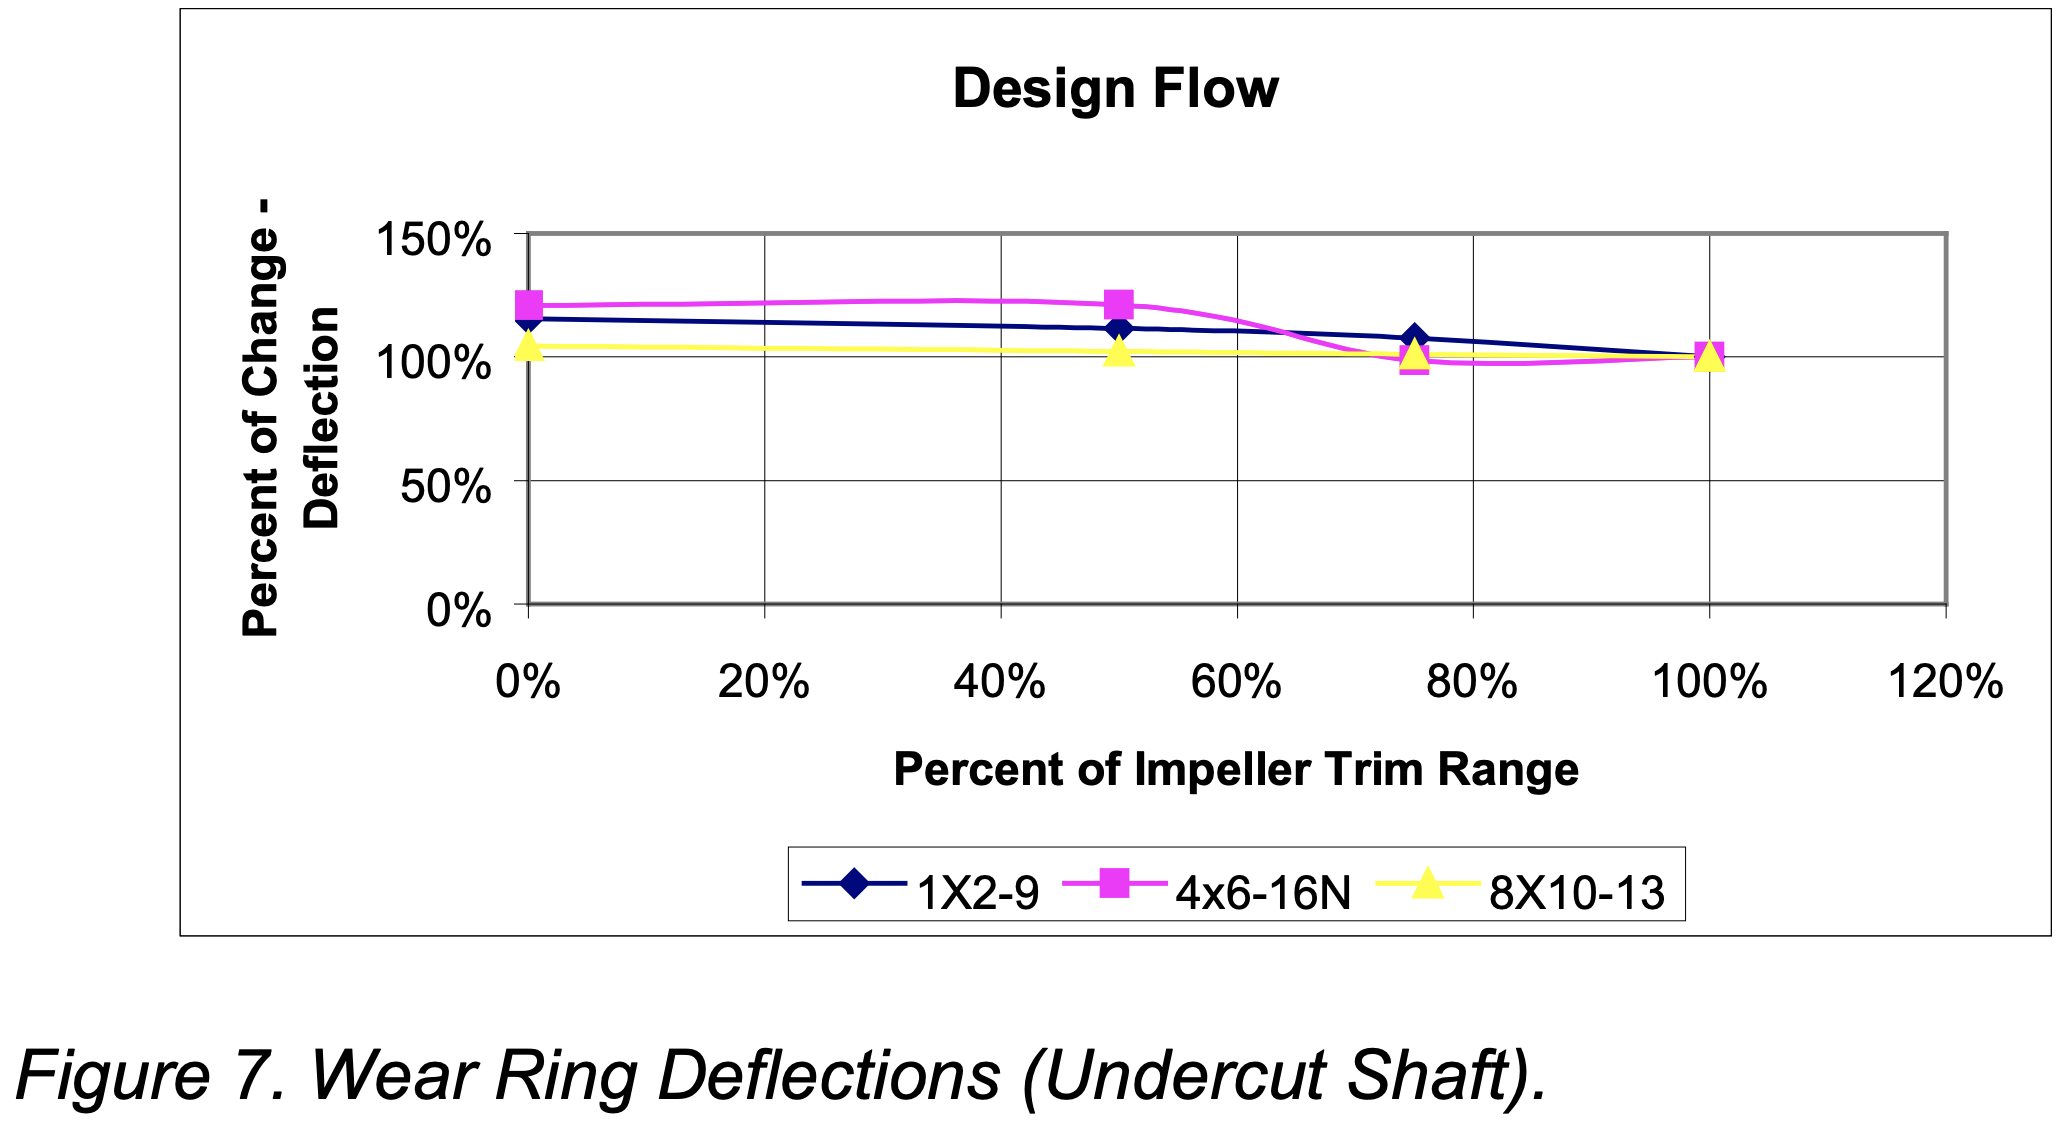
The original test plan was to monitor shaft deflection at the suction side wear ring as impeller diameter and flow rate was varied. As discussed previously the pump shaft was undercut to reduce stiffness and exaggerate deflection. When the deflection data was examined it did not show the expected behavior.
Figure 7 shows the percent change in impeller deflection for various impeller trims at best efficiency capacity. Contrary to expectations the deflection was found to be maximum at the smallest diameter for all pumps tested. It is also noted that the sensitivity to deflection vs. impeller diameter increased for pumps having higher head. This data is typical of what was found at all flows and speeds tested.
Upon study of the experimental model it was discovered that undercutting the shaft had weakened it to the point where the Lomakin Effect stiffness due to the wear rings became a significant portion of the wet rotor stiffness. For the 4×6-16N the undercut dry shaft stiffness was reduced to approximately 20% of the unmodified dry shaft stiffness. As a result the Lomakin stiffness contribution increased from less than 5% for the unmodified wet rotor stiffness to approximately 25% for the undercut wet rotor stiffness.
Calculations were performed to validate this supposition. From Black, et.al. [6] the Lomakin stiffness coefficient (or spring constant) is calculated from:

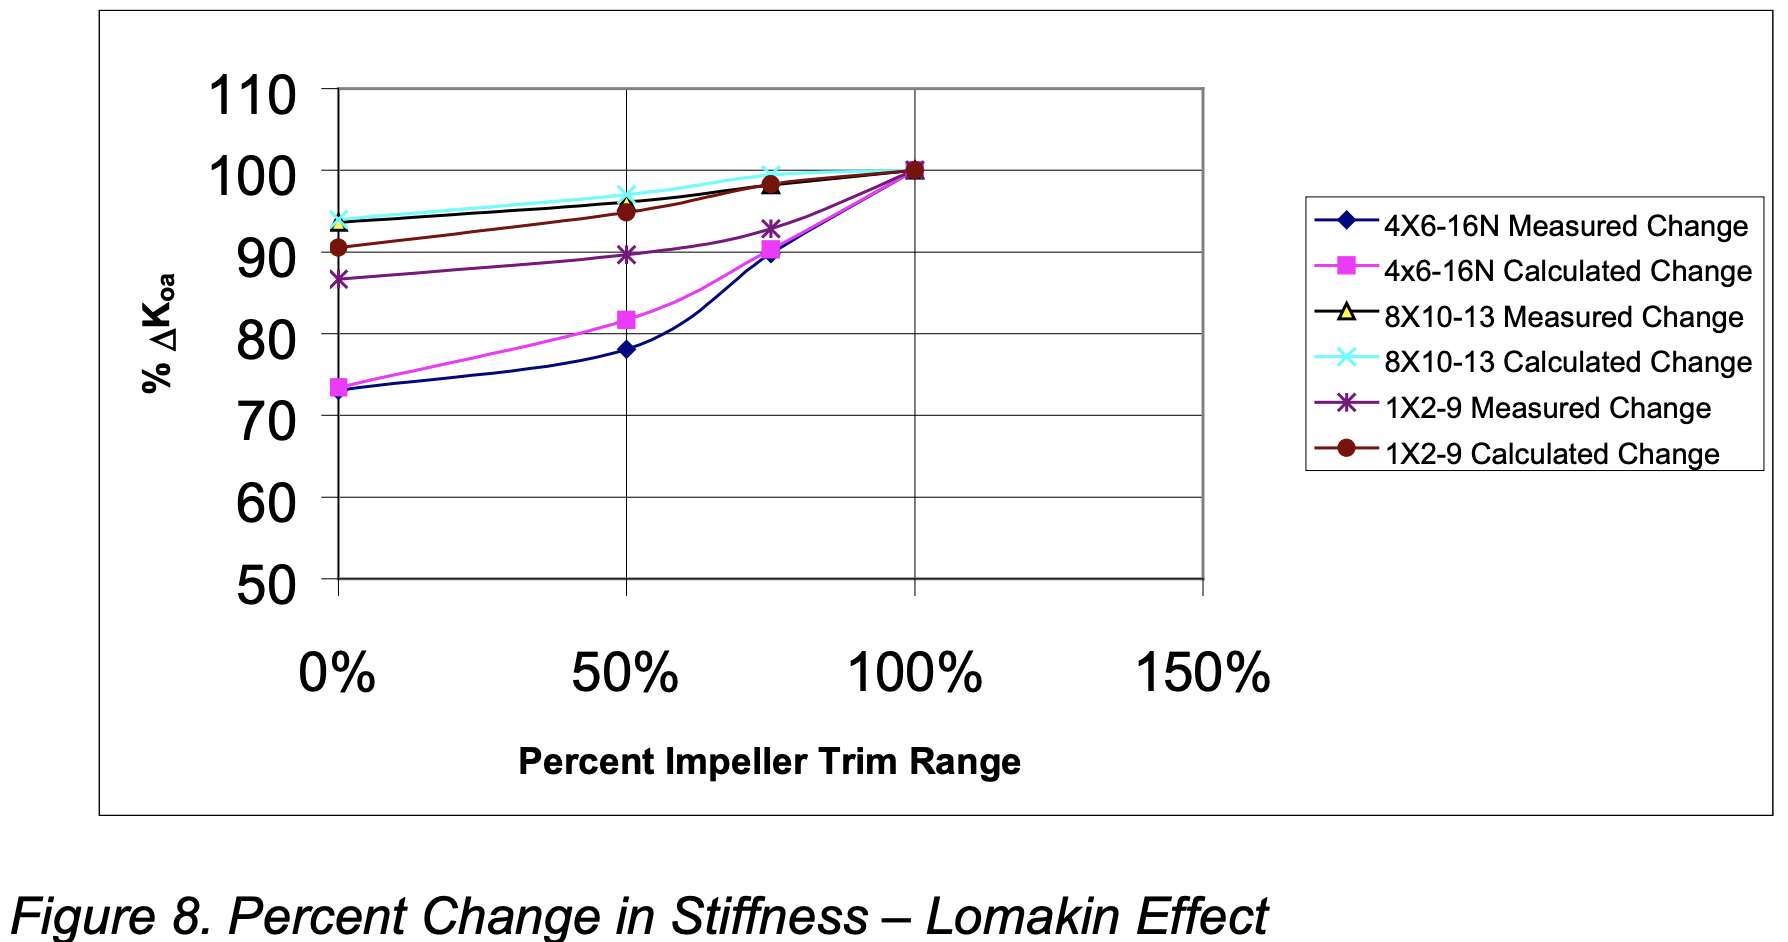
The combined shaft and Lomakin stiffness (koa) can be calculated for all impeller trims using measured defection data and resultant hydraulic radial loads as:
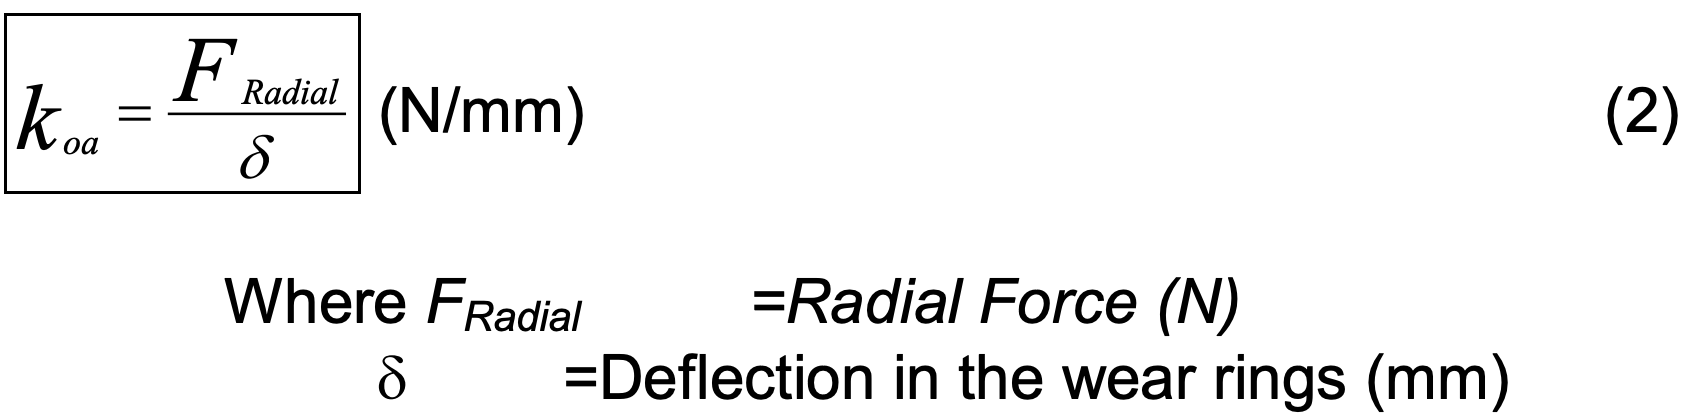
The overall stiffness can also be expressed as:
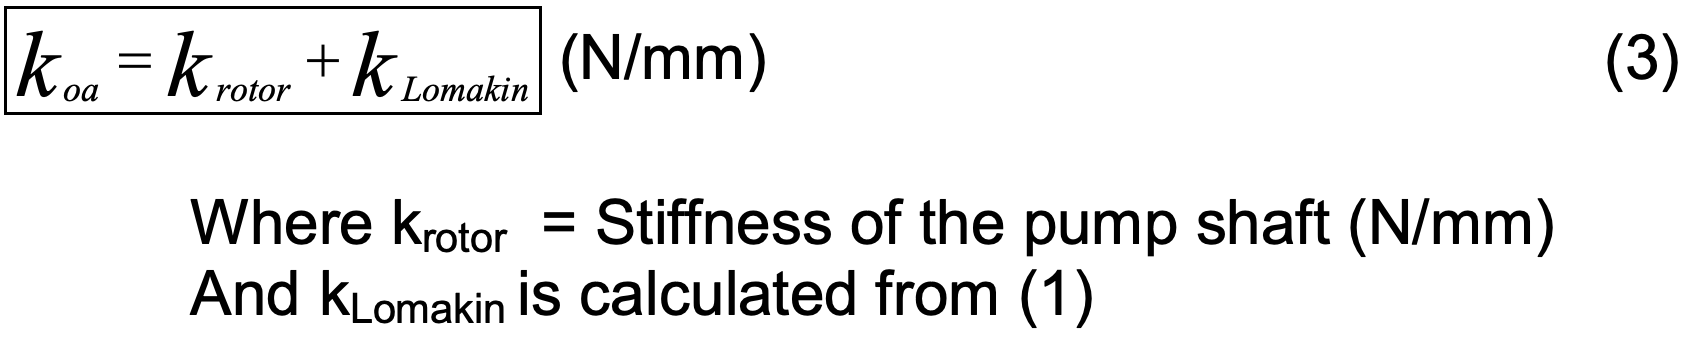
A comparison of the change in measured stiffness koa (2) expressed as a percentage of full diameter stiffness and the percent change in calculated stiffness (3) was made and is shown in Figure 8. The close correlation between the measured and calculated stiffness validates the supposition that the Lomakin Effect influenced the deflection data.
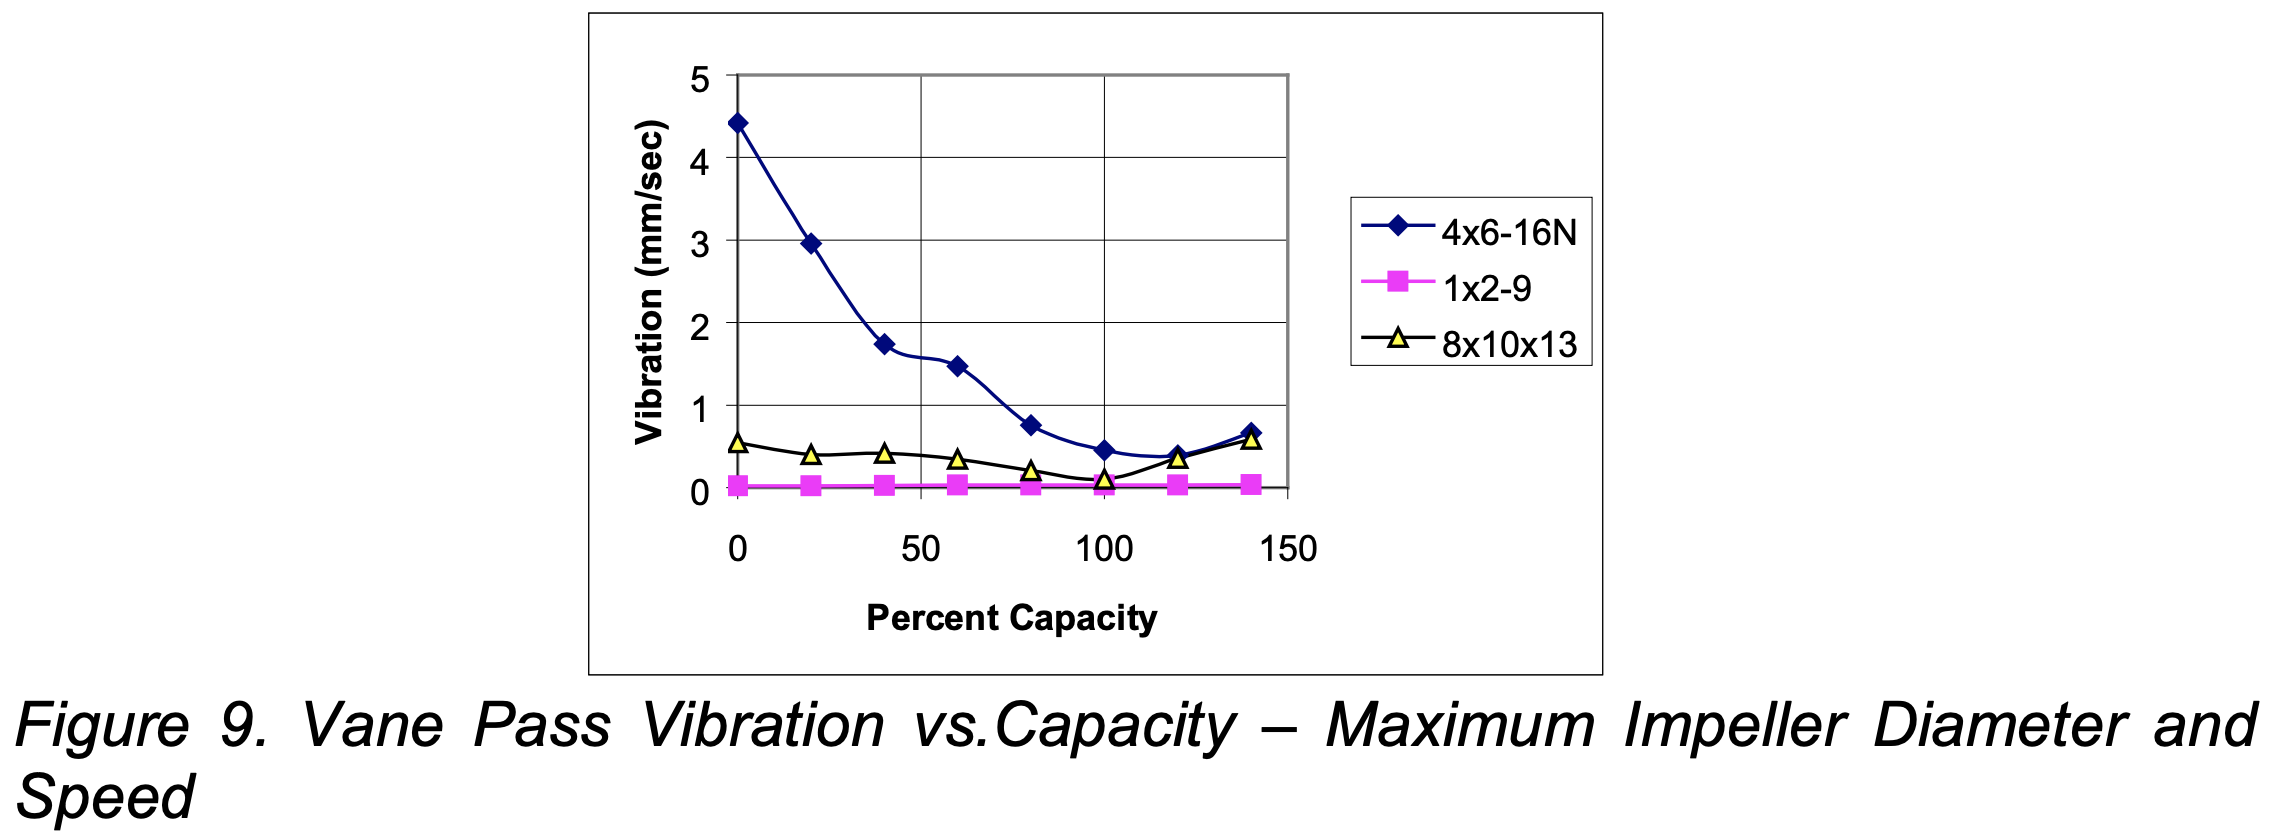
Capacity Reliability Factor
As noted above, shaft deflection was found to be confounded by the Lomakin Effect. Examination of the overall vibration data showed that it was affected by impeller balance, coupling alignment, and test setup. It was not therefore used as an indicator. It was found that the overall pressure pulsations, vane pass pressure pulsations and HFD tracked the shape of vane pass vibration at each capacity. The authors therefore decided to use vane pass vibrations as an indicator. Figure 9 shows the full speed and maximum impeller trim vane pass vibration data vs. capacity for all pumps tested.
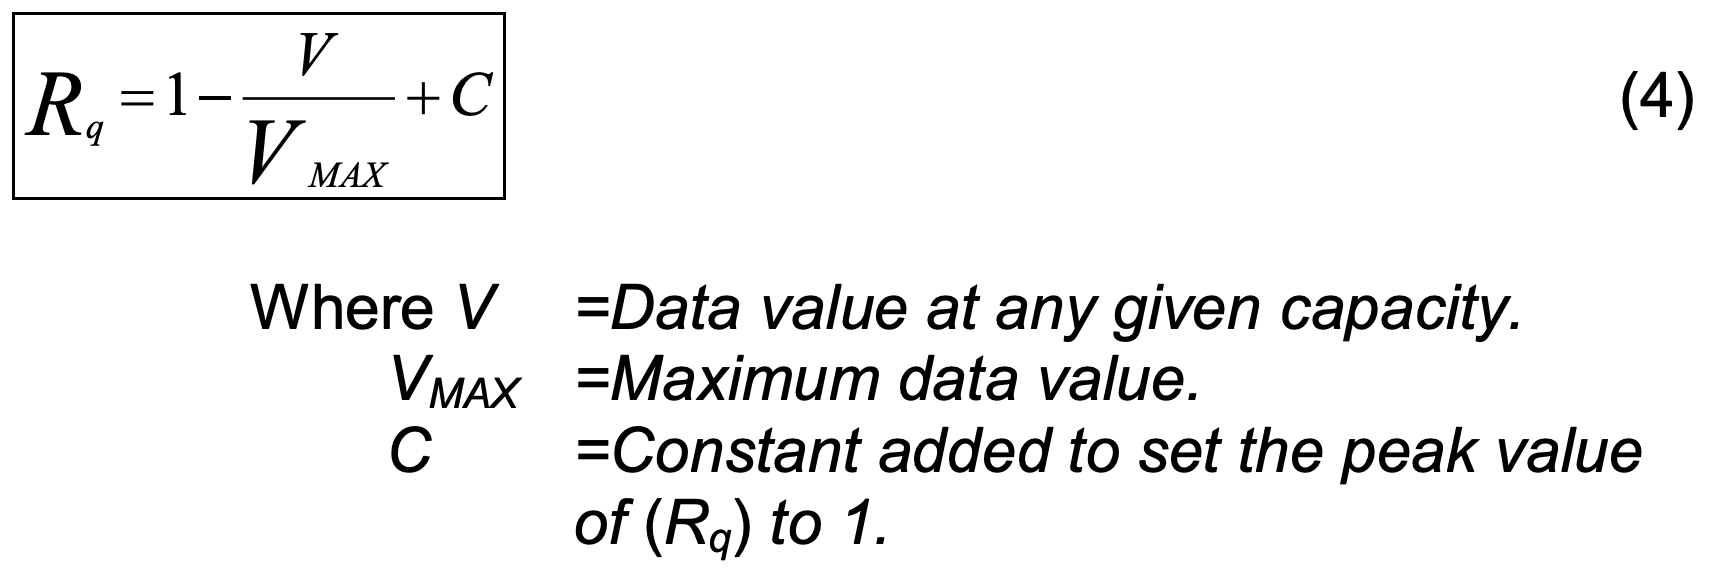
The Capacity Reliability Factor (Rq) is a number between 0 and 1 with 1 being the most reliable. In an attempt to quantify this factor, the authors normalized the vane pass vibration data according to the following formula:
The calculated reliability numbers were then compared to the curve by Bloch [2]. Figure 10 shows the results of that comparison.
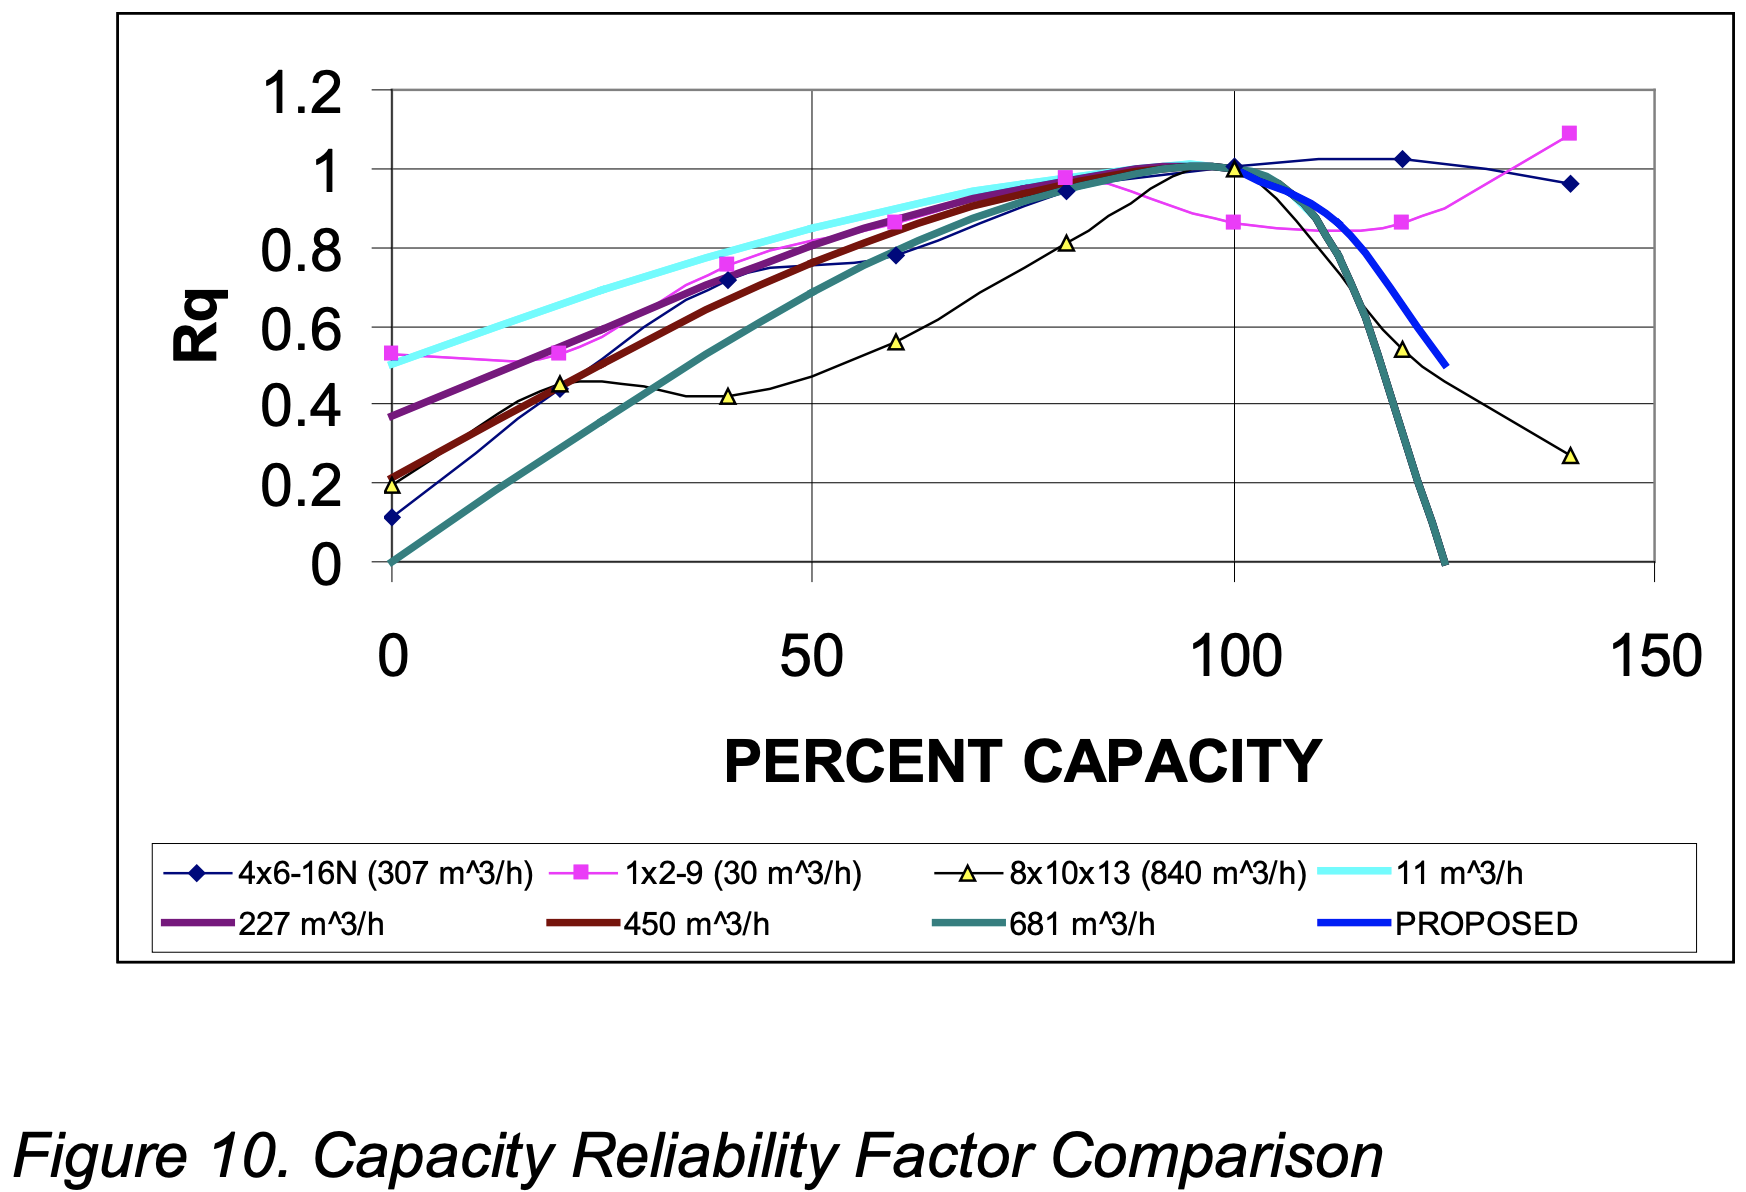
As can be seen from the result the data tracks the curve below 100% capacity quite well and is therefore a good indicator in that region. The results indicate that the pumps are more reliable in the region beyond 100% capacity.
Bloch [2] notes that the reason that the capacity reliability factor is reduced beyond best efficiency point is due to rapidly increasing NPSHR. The present data suggests that if a large NPSH margin is available, the reliability factor should not be degraded significantly beyond best efficiency point.
Impeller Diameter Reliability Factor
The impeller trim range is defined as the range between the maximum and minimum published impeller diameters. The authors initially chose to analyze vane pass pressure pulsation and HFD vs. impeller trim because:
- Dynamic deflections caused by vane pass pressure pulsations affect bearing and mechanical seal life.
- HFD is a good indicator of mechanical and hydraulic conditions within a pump, particularly in impellers with lesser vane overlap.
It was found in all cases (all three pumps, all capacities and all pump speeds) that the pressure pulsations decreased with impeller trim, i.e. the greater the impeller to cut water clearance the lower the pressure pulsation values. The authors also found in all cases that HFD values increased with impeller trim. Since both sets of data change differently with diameter it is reasoned that the maximum reliability occurs somewhere within the trim range.
Figures 11 (HFD vs. trim range) and Figure 12 (vane pass pressure pulsations vs. trim range) are typical for all pumps tested.
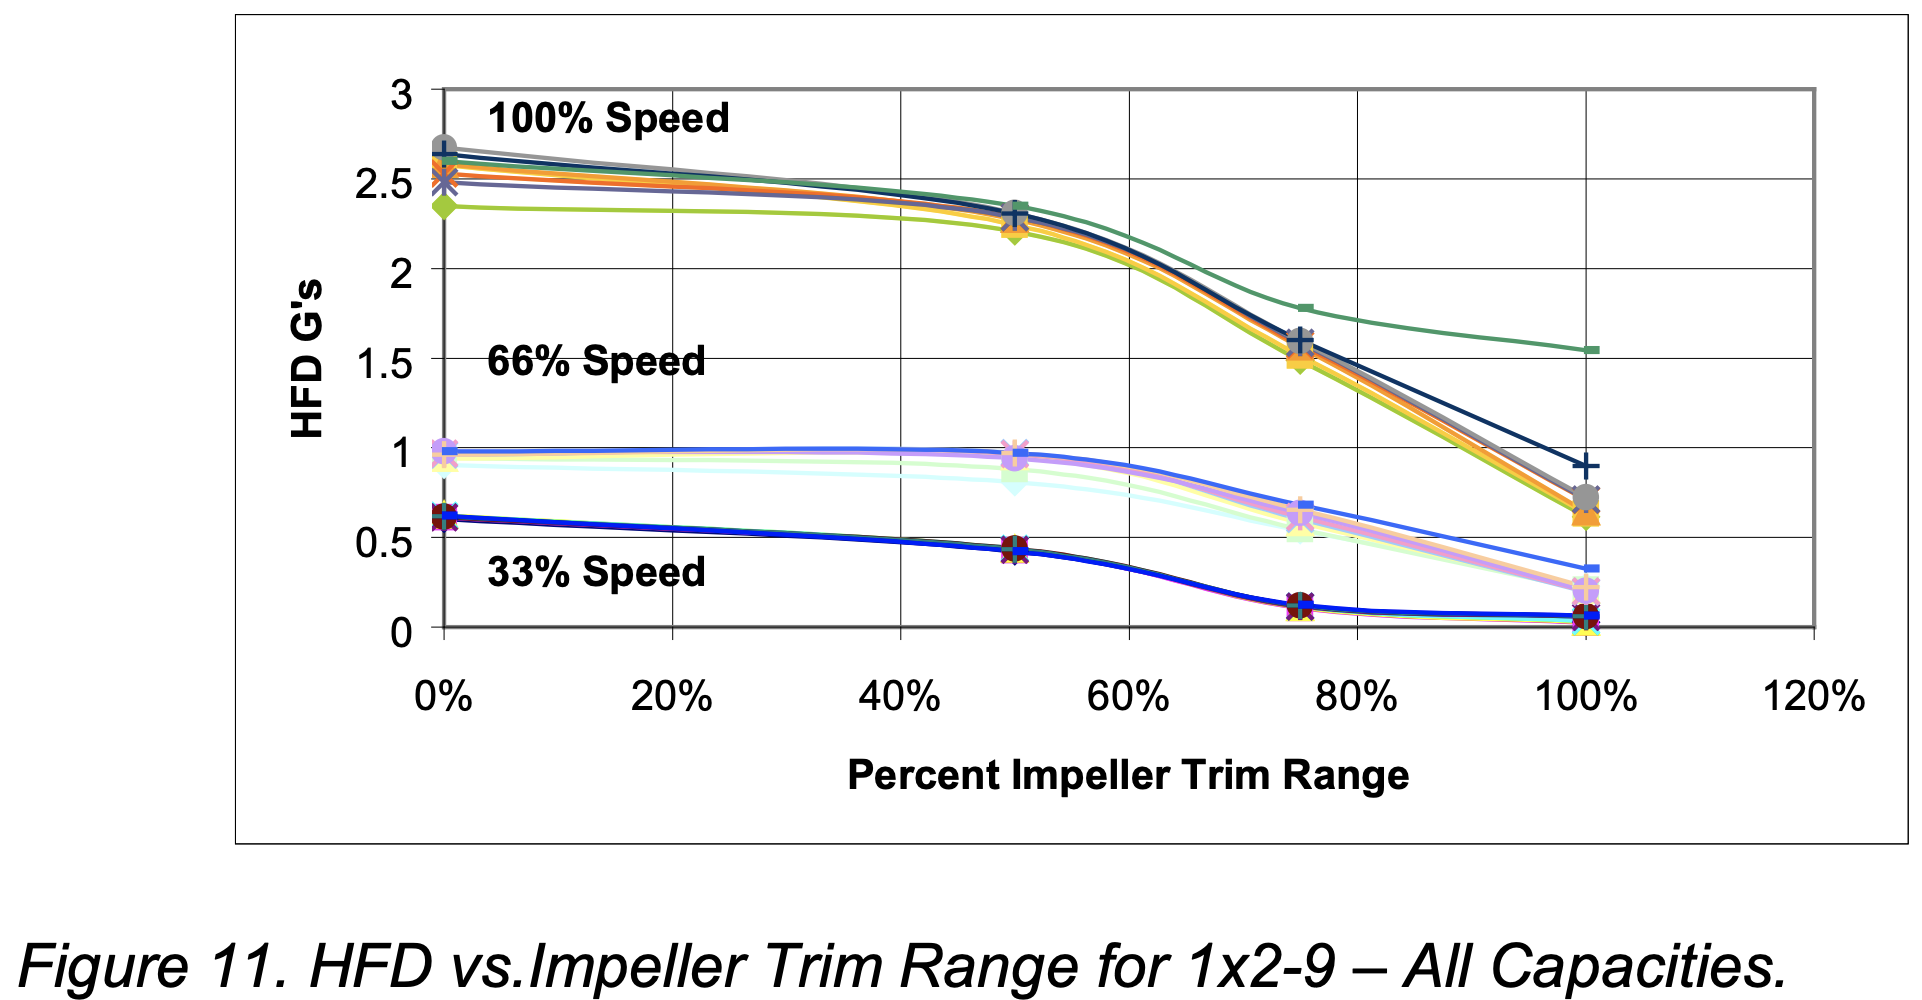
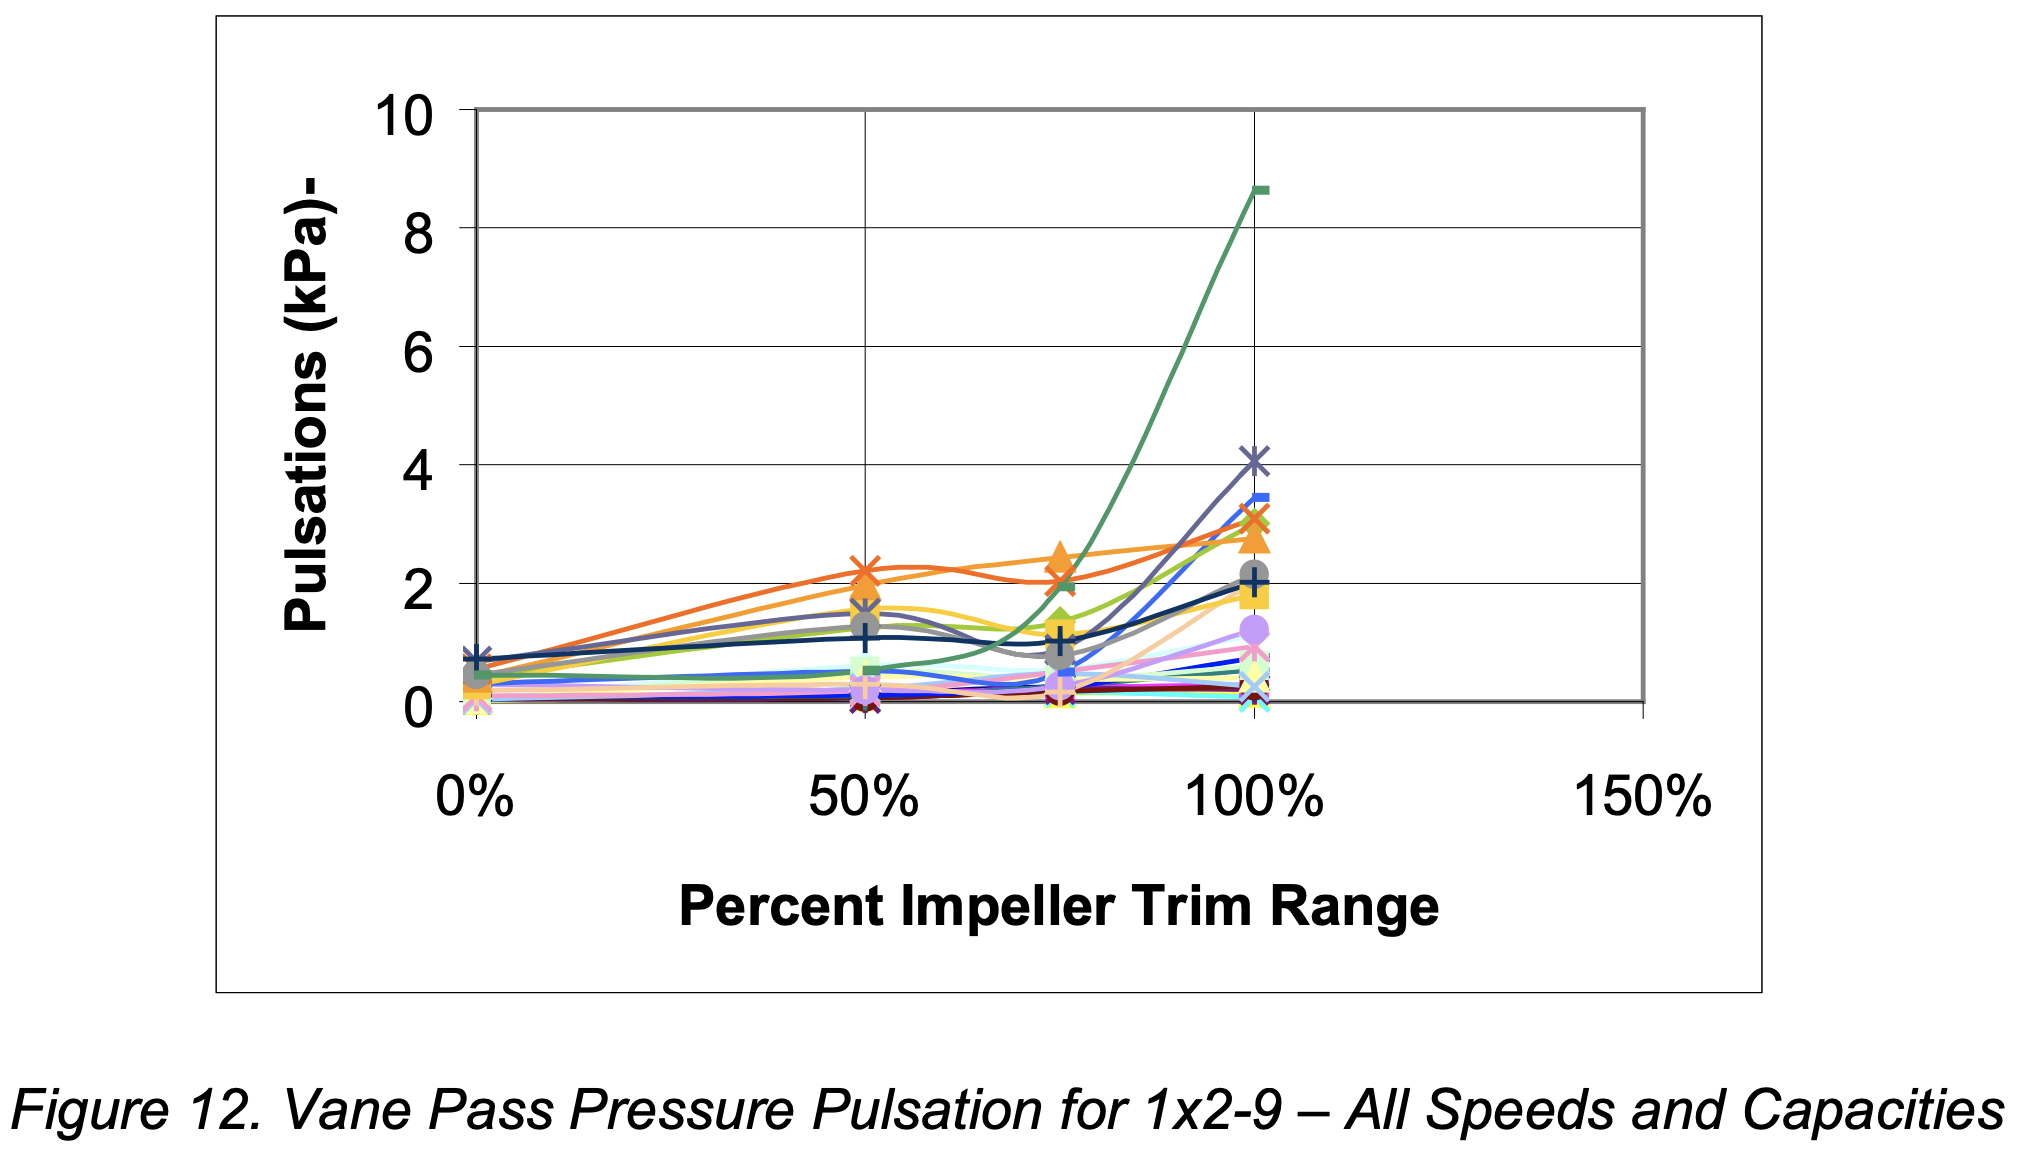
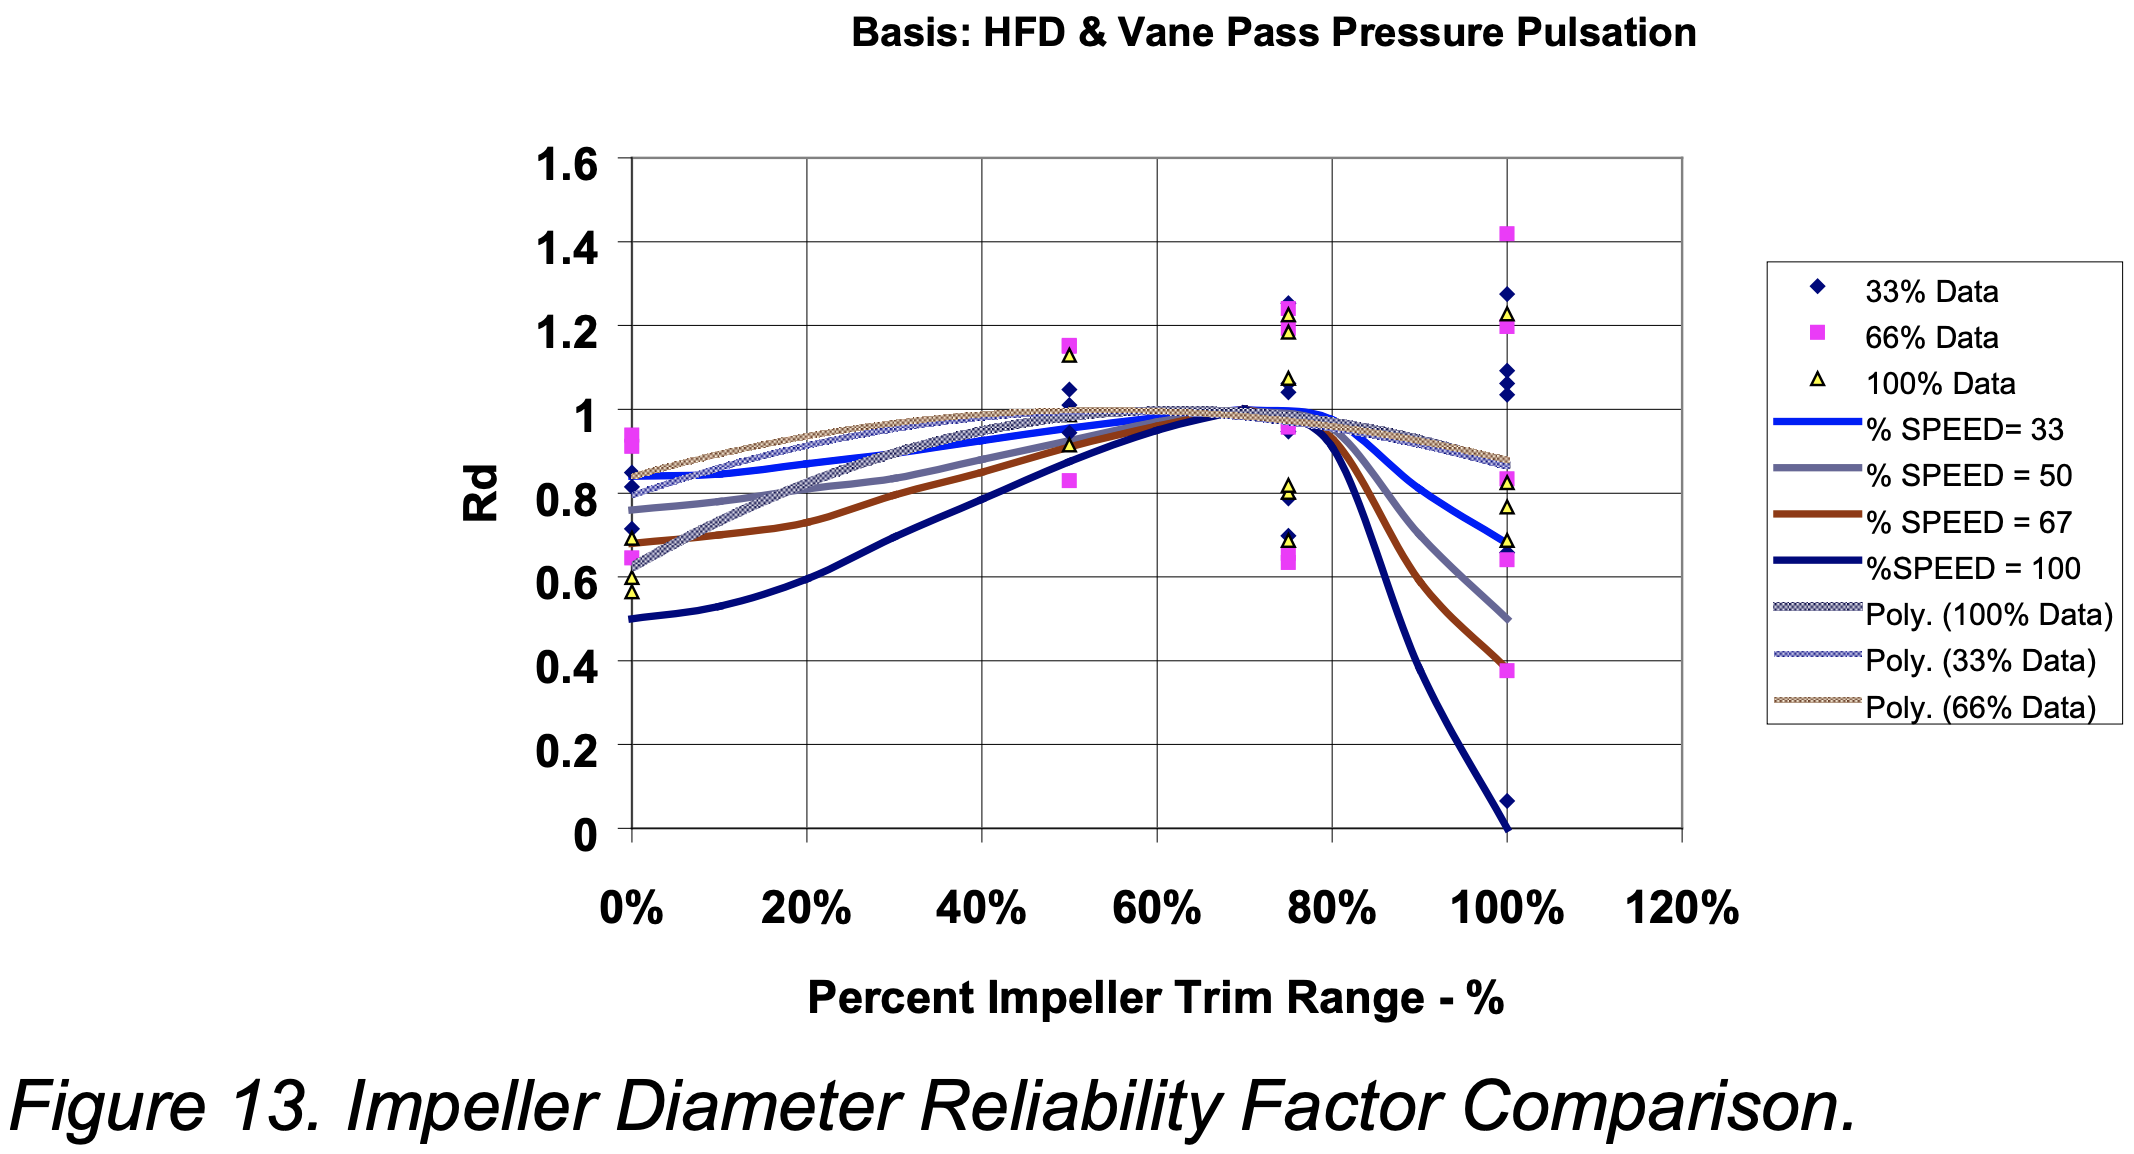
The Diameter Reliability Factor (RD) is a number between 0 and 1 with 1 being the most reliable. In an attempt to quantify this factor, the authors normalized the vane pass pressure pulsation data and the HFD using the same criterion (4) as for the Capacity Reliability Factor. However in this case, all the normalized data points (vane pass pressure pulsation and HFD vs. percent trim range) were combined according to percent at maximum speed. Second order polynomial curve fits were applied to each normalized speed data set. Results were plotted and compared to the published Diameter Reliability Factor. Figure 13 shows the results of that comparison.
As can be seen from the result the data tracks the curve below 75% trim range reasonably well and is therefore a good reliability indicator in that region. Maximum reliability appears to occur between 60% and 80% of trim range again validating the curve. However, the results indicate that the pumps are more reliable in the region beyond 75% trim range and that the curve should be adjusted to reflect these findings. All of the normalized data curves converged to a single line beyond the 75% trim range with a value at 100% trim equaling 0.85.
Conclusions
This paper reports on a unique investigation into the effects of speed, impeller diameter trim and operating point on the reliability of a centrifugal pump. The study was prompted by the Reliability Index first reported in Bloch [2] and was designed to validate that proposal. The conclusions drawn are:
- Pump reliability is linearly related to RPM and has the same slope as proposed in Bloch.
- The proposed capacity reliability factor curves to the left of best efficiency capacity are generally supported by the data. To the right of best efficiency capacity the data suggests the Bloch curve is too low. The NPSHA during the test program was 5 to 10 times the NPSHR, which explains the discrepancy. We recommend the Bloch curve be modified as shown in Figure 10 when the NPSHA is more than 5X NPSHR.
- The experimental data suggests there is an optimum impeller trim for reliability. That optimum is between 60% – 80% of the trim range and agrees well with Bloch. The data also suggests that the Bloch curve is too low (pessimistic) above the optimum trim and that the impeller diameter reliability factor is not speed dependent above the optimum diameter.
- Experimentally it was found that undercutting the shaft to amplify deflection allowed the Lomakin effect to distort the data. With a standard shaft this would not have occurred.
Recommendations
The authors recommend that this work be extended further. Particular investigations should focus on:
- Gathering additional experimental data on the impeller trim and operating point factors.
- Testing should be done on pumps that do not have wear rings to eliminate potential distortion of the data due to the Lomakin Effect.
- Although experimental data is important, the reliability factors only have value if they reflect operational experience. The authors strongly recommend further studies to correlate with field data.
Source: ITT Goulds Pumps
References:
- Hrivnak, S. J., ASME B73.1M Pump Reliability Program Formation; A Data Based Approach, 13th International Pump Users Symposium, Houston Texas, March 5–7 (1996).
- Bloch, H.P. and Geitner, F.K., “An Introduction to Machinery Reliability Assessment”, 2nd ed., Gulf Publishing Co., Houston, TX (1994).
- Private communication – J. Fitch, Diagnetics Company
- Johnson R., Schoenherr K., Wear Control Handbook.
- Karassik, Krutzsch, Fraser and Messina, “Pump Handbook”, 1st ed., McGraw-Hill Book Co., New York (1986).
- Black, H. F. and Jenssen, D. N., “Effects of High Pressure Ring Seals on Pump Rotor Vibration,” ASME, 71-WA-FE-36.