ITT Goulds Pumps Shares TCO Formula
Written by Tom Dabbs, Reliability Specialist of Plant Performance Services Group, ITT Goulds
Many facilities shop for pumps based on price, but industry data shows initial costs represent only 10 percent of the Total Cost of Ownership
Optimizing Total Cost of Ownership (TCO)
How much does a pump cost? Ask a corporate executive or plant manager about the cost of a piece of equipment, and you’re likely to hear the purchase price. In fact, however, capital outlay is only a fraction of total operating expenses for rotating equipment. Companies that want to compete effectively should carefully measure total costs and analyze them as part of system design and equipment purchase decisions.
As Lord Kelvin, the renowned British physicist, mathematician and engineer said in 1883:
“When you can measure what you are speaking about, and express it in numbers, you know something about it; but when you cannot measure it, when you cannot express it in numbers, your knowledge is of a meager and unsatisfactory kind.”
When managers measure and analyze the elements of Total Cost of Ownership (TCO) sufficiently to understand and optimize them better than anyone else, their organization is likely to be an industry leader. Fittingly, Lord Kelvin also said this about the value of analysis:
“The more you understand what is wrong with a figure, the more valuable that figure becomes.”
Optimizing TCO is a difficult process for organizations to plan and sustain, but this white paper contains multiple case studies that show the payoff is worth the effort. Most organizations that succeed at optimizing TCO have leaders who demand cooperation between functional groups. They recognize that optimizing costs is a function of operations, maintenance and the purchasing department working toward the common goal of lowering total costs. They also insist on the discipline to always follow proper work processes.
The TCO Formula
Total Cost of Ownership analysis is simply a financial estimate of all costs — direct and indirect — of acquiring, commissioning, operating, maintaining and disposing of a product or system for a specified period of time. The analysis can be used to effectively compare alternative approaches. One can understand these costs by using this model for pumping systems that can be extended to almost any class of manufacturing equipment:
TCO = Ca + Cc + Co + Cm + Cp + Cd
Where:
Ca = Cost of Acquisition — includes the cost of engineering, procurement, equipment cost, auxiliary equipment cost, inspections and documentation.
Cc = Cost of Commissioning — includes the cost of construction, testing, training and technical support.
Co = Cost of Operation — includes energy, operating personnel, facility costs, support and handling for raw materials.
Cm = Cost of Maintenance — includes maintenance personnel, maintenance facility cost, test equipment, maintenance support and handling cost, maintenance spares and repair parts.
Cp = Cost of Production — includes production losses, quality cost, environmental cost and cost of redundancy.
Cd = Removal and Disposal — minus any reclamation value.
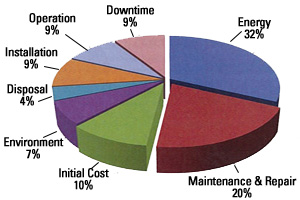
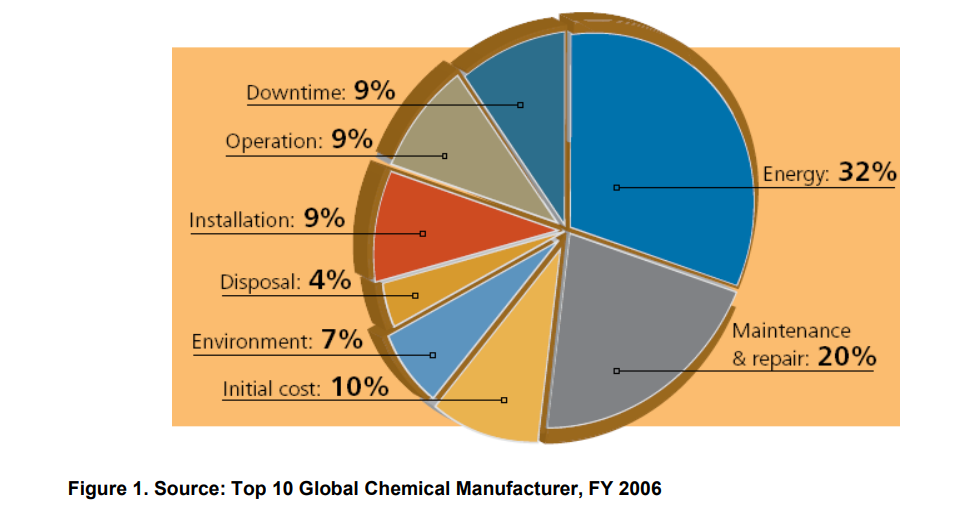
ITT Goulds also has adopted benchmarks for the typical weight of different cost factors that comprise TCO as seen in Figure 1. Taken from a Top 10 Global Chemical Manufacturer, this breakdown allows us to compare a customer’s actual costs to a sample of industry data. It is interesting to note that initial cost typically represents less than 10 percent of TCO. Energy and maintenance costs have at least five times more relevance but are rarely considered during the selection process. The adage, “Pay me now or pay me later,” can ring painfully true for managers who don’t look at the entire picture.
Specifying the Right Size Pump
The first opportunity to optimize TCO is during the design phase. Specifying the right equipment for the right application is critical to operating efficiently, which lowers the energy, operation and maintenance expenses that comprise more that 60 percent of total cost of ownership.
Many engineers specify oversized pumps on the theory that it is better to err on the side of having too much power for the application than too little. If the flow of the system is too high coming out of the pump, it simply can be throttled back using a valve on the discharge side. This arrangement is a very inefficient and costly way to configure a system. It increases energy costs for operating the pump, reduces the operating life of the equipment and likely increases downtime.
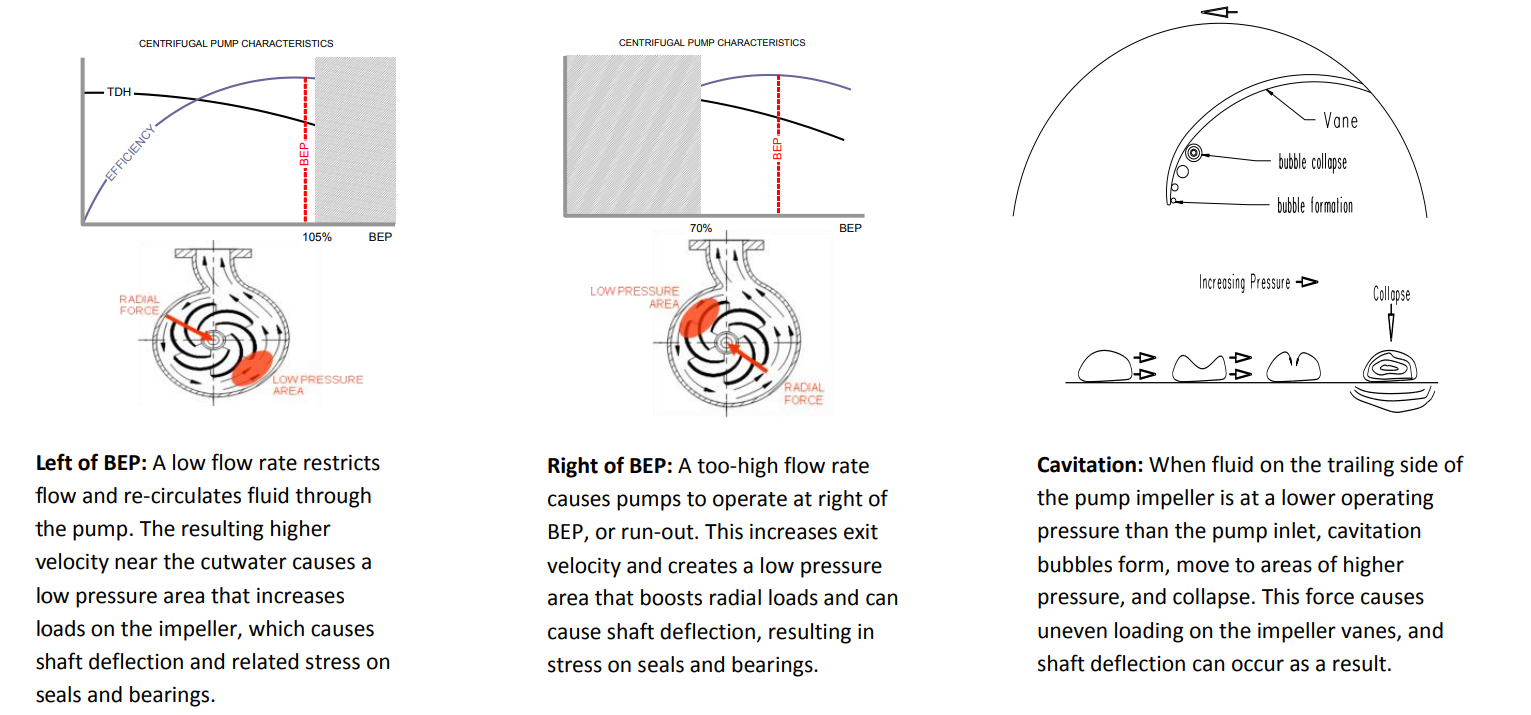
To understand why, it’s important to know the basics of how a pump works. Centrifugal pumps operate with a rotating impeller, which imparts velocity energy to the liquid. The impeller accelerates the liquid and discharges it into the casing, and as the casing area increases, the velocity energy is converted to pressure. Higher velocity brings higher pressure.
Pumps are designed for specific flow ranges. When a pump is operating optimally — or at its Best Efficiency Point (BEP) — liquid flow is constant and radial forces acting on the impeller are balanced. This allows the pump to experience the highest efficiencies and lowest vibration. If the pump runs off-BEP — at a significantly faster or slower flow rate than optimum — it creates an imbalance of pressure inside the pump. Any of these problems can cause shaft deflection, which increases stress on the pump’s bearings and mechanical seals — and the likelihood of pump failures.
Pump Case Study 1: Too Much Suction Causes Too Many Failures
A large paper manufacturer installed a critical process pump on one of its paper machines. The pump demonstrated high vibration levels from the beginning and an abnormally high failure rate — mean time between failures (MTBF) was less than nine months. After many unsuccessful attempts to solve this problem, the plant sought outside assistance to perform a Root Cause Failure Analysis. The analysis showed that cavitation was the reason for the failures, but the root cause was that suction energy in the pump was too high. The ultimate solution was to install a different pump with lower suction energy.
After the replacement pump was in service, online condition monitoring revealed that the new motor’s running temperature decreased by 75°F (24°C) compared to the previous pump. Bearing temperatures also decreased by 30°F (-1°C) on the new pump. The solution reduced the pump’s overall vibration by 89 percent, eliminated the pump cavitation and reduced its energy consumption by approximately 30 percent. It also resulted in more reliability for control valves in the system. Valves that had been run 20 to 30 percent open now could operate at 50 to 70 percent open. The new pump has operated flawlessly for more than five years after the solution was implemented. The reduction in maintenance costs, along with the increased capacity from avoiding failures, show that TCO was significantly improved.
Pump Acquisition Cost and Performance Tradeoffs
In addition to specifying the right size pump for the application, it is important to select a pump supplier with TCO in mind. Focusing on purchase price alone can produce short-sighted decisions, a dynamic that some suppliers understand all too well.
For example, if a supplier knows that a company is prone to making decisions based solely on low price, the game is simple. They provide an attractive price that might be at or below cost, then make up the difference by restricting market access and inflating prices on parts and services. In most cases, the cost to the customer from this approach is much higher than if choosing a more reputable supplier.
Another risk of focusing on purchase price alone can be more costly. Lower-cost components that do not meet original equipment manufacturer (OEM) specifications most likely deliver lower performance characteristics, a virtual guarantee for higher TCO over the life of the equipment.
To verify this point, ITT recently conducted a comparison of ANSI standard pumps of identical size from ITT and non-OEM suppliers. Performance tests were conducted on four sizes of ANSI pumps:
• 1×1.5-6 ((1-in.(25mm) discharge flange, 1.5-in.(38mm) suction flange, 6-in.(152mm) impeller))
• 1×1.5-8
• 1.5×3-13
• 2×3-6
The testing was performed in accordance with ASME B73.1 and Hydraulic Institute Standard 1.6, Level A, which includes guidelines and uniform procedures for testing, recording data and acceptance criteria for centrifugal pumps. Level A testing uses clean water and involves monitoring the rate of flow, system head, input power and pump speed. Level A acceptance criteria states that “no minus tolerances or margin shall be allowed with respect to rate of flow, total head or efficiency at the rated or specified conditions.”
Each pump was tested as-received, with only the impeller clearance being set per the product installation, operation and maintenance (IOM) manual. While the size of the differential varied, the OEM pumps outperformed their non-OEM counterparts in every measure on every test.
• Non-OEM pumps failed to match the OEM pump performance for flow, head and efficiency.
• Non-OEM pumps performed an average of 10.25 percent lower in efficiency than the OEM counterpart.
• Non-OEM pumps did not perform in accordance with their own published performance curves and therefore did not conform to the ASME standard.
• At a standard electricity cost of 7.6 cents per kilowatt hour, the lower efficiency of the non-OEM pumps would translate into wasted energy costs of at least $1,100 per year per pump, and as much as $3,700 per year on a medium-sized pump, based on continuous operation.
[For details, see “Not All ANSI Pumps Are Created Equal,” by Patrick Prayne, available at pump-zone.com]
Pump Case Study 2: Non-OEM Parts Go Up in Smoke
A customer recently purchased lower-cost, pump replacement parts from a non-OEM supplier that caused a major loss in production and inferior performance that increased energy consumption. The application was a typical condensate service, for which the customer used a standard OEM pump. After an above-average time in service, the wet-end components were scheduled to be replaced due to routine wear.
Against the recommendations of the company’s maintenance team, the purchasing department chose non-OEM replacement parts based on lowest price. Within a few hours of the new wet-end’s installation, the pump began smoking and ultimately failed. Maintenance engineers discovered that the non-OEM stuffing box cover bore was undersized by 1/32 (0.8mm) to 1/16 (1.6mm) of an inch, and the gland studs were off-center from the bore. The gland, stuffing box cover and shaft were nonconcentric, which damaged the shaft sleeve and caused the pump to fail. The pump was put back into service with a new OEM-supplied stuffing box, but still with the non-OEM impeller and casing.
Further analysis revealed that in addition to the production losses associated with this failure, the non-OEM parts significantly increased energy consumption. The customer’s original specifications called for 900 gallons per minute (204 cubic meters per hour) with a head of 180 feet (55m), an efficiency of 68 percent at 60 horsepower (45kw). With the remaining non-OEM liquid-end parts, the pump was actually running at 954 (217 cubic meters per hour) gallons per minute with a head of only 114 feet (35m), while consuming 56 horsepower (42kw) at an efficiency of 49 percent. The inefficiency and underperformance of the non-OEM parts generated approximately US$7,600 per year in additional energy costs. In addition, the pump had been out of service for four weeks for troubleshooting and analysis of the defective parts.
Managing Pump Equipment Inventory
Selecting equipment and parts based solely on purchase price over long periods can cause other unintended consequences that inflate TCO. Buying like items from multiple vendors requires operators and maintenance personnel to be trained on each vendor’s operating guidelines and procedures. In addition, storerooms must stock parts for each vendor’s equipment. This can inflate MRO inventory values and tie up precious capital dollars.
Pump Case Study 3: Parts Problem at Paper Plant
A paper company with more than 4,000 pumps at five pulp-and-paper facilities tended to buy pumps based on low purchase price over many years. As a result of this approach, the company owned excessive spare items to support more than three lines of pumps with excessive quantities of spares stocked for each item. After a third-party analysis, maintenance and purchasing teams consolidated and standardized pumps and parts. The change resulted in inventory-value and inventory-handling cost reductions of more than $120,000 per location with minimal implementation costs.
Ensuring Quality Pump Repairs
It’s common that pumps repaired in companies’ internal shops fail prematurely, based on the fact that workers seldom follow OEM standards to perform the work and often fail to adequately assess the quality of their work. This is generally attributed to skill level but can be directly dependent on the environment where the repairs are made. It’s proven that making repairs per OEM specifications to like-new condition can contribute to improved performance. Typically, the cost of pump repair alone is five to 15 times more than the cost of the effort that would have prevented the failure.
Pump Case Study 4a: 700 Maintenance Challenges at Chemical Plant
A specialty chemicals plant with more than 700 installed pumps experienced an abnormally low average MTBF of 15.4 months and elevated operations costs that averaged $5,070 annually. Several issues contributed to this poor performance, but a significant factor was premature failure, or “infant mortality,” of pumps due to equipment repairs that were not made in accordance with specification. Once these issues were minimized, the average MTBF increased to 32.1 months and average operating costs decreased to $2,565 per year, not including increased production made possible by having fewer failures. Overall TCO was reduced by more than $1.3 million within one year. Based on this success, the company embedded an OEM engineer on site who is dedicated to improving pump performance and reducing costs. The onsite OEM representative has generated a positive return on investment with similar financial improvements annually for more than eight consecutive years, achieving similar financial improvements to the ones described above.
Pump Case Study 4b: Oil Refinery Reforms Bad Actors
Analysis of the work history at an oil refinery revealed 30 bad-actor pumps that had an average MTBF of less than one year. Root cause failure analysis on these pumps revealed a range of issues, including improper lubrication, inadequate maintenance procedures, incorrect equipment selection, insufficient operating procedures and improper control methods. Over a two year period while these issues were being resolved, average MTBF more than tripled, repair costs were reduced by more than 75 percent and emissions were reduced by 95 percent. These are significant contributors to reducing TCO.
Role of Operations and Maintenance in Managing Pump Equipment TCO
Many executives and senior leaders believe the maintenance department alone can deliver reliability to the operation and, by doing so, will contribute most significantly to TCO improvements. While maintenance is a necessary component, optimizing TCO must be an organization-wide initiative, established by the deployment of disciplined and integrated processes and practices. Reliability can be likened to safety, in that everyone must follow the procedures and practices to achieve success. According to Ron Moore of the RM Group, Inc., the following elements are essential to establish reliability:
• Appropriate specification and design practices
• Professional purchasing practices
• Adequate and clean storage facilities
• Precise installation and methods
• Well defined and consistent start-up and commissioning procedures
• Consistent operating practices
• Proactive maintenance processes
• Precision maintenance practices
To create a proactive maintenance culture and achieve reliability, it is imperative that operating parameters be well defined and documented via standard operating procedures and that operators are effectively trained to follow them. Before operators perform tasks such as cleaning, inspections or lubrication, they must be adequately trained in these procedures and their associated safety requirements. Operators are the most effective condition monitors. They should be encouraged to participate in continuously observing their pump equipment and spotting abnormal conditions before they become breakdowns.
TCO Analysis — A Powerful Tool
Total Cost of Ownership analysis can be used as a basis for decision making in almost any industry or business, including manufacturing, computer systems, transportation, buildings, real estate, and medical and laboratory equipment. TCO analysis provides the critical foundation for making sound decisions about:
• Budgeting (Capital & Expense)
• Planning
• Staffing
• Vendor Selection
• Inventory Requirements
• Lease vs. Buy decisions
Though the basic concepts are easy to understand, few organizations are able to apply them routinely and across the board. The biggest likely reason is that cost information for each event during the life of an equipment item, like a repair or replacement, is only available and traceable if someone enters the event and associated costs into a system. Another major reason is that reactive environments prevent managers from staying on track — being diligent about not only recording cost data, but analyzing the data and acting on the results of the analysis. When an emergency occurs in a plant, it puts everyone in a tailspin until production is restored. Managers don’t always get back to the proactive “should-do” activities they were working on before the “must-do” demands of the emergency.
TCO analysis by itself will not solve many problems. What’s needed are leaders who continuously strive to improve performance, supported by workers and managers who are willing to change their behavior and embrace new, more efficient ways of doing things. Organizations that do this well tend to be industry leaders with higher productivity and profitability than their competitors. But the five case studies featured in this paper do not all match that description. They demonstrate that every effort to analyze and optimize total costs of ownership, instead of acquisition costs alone, is likely to yield a very positive return on investment.
Source: ITT Goulds
About ITT
ITT Corporation is a high-technology engineering and manufacturing company operating on all seven continents in three vital markets: water and fluids management, global defense and security, and motion and flow control. With a heritage of innovation, ITT partners with its customers to deliver extraordinary solutions that create more livable environments, provide protection and safety and connect our world. Headquartered in White Plains, N.Y., the company generated 2009 revenue of $10.9 billion. www.itt.com